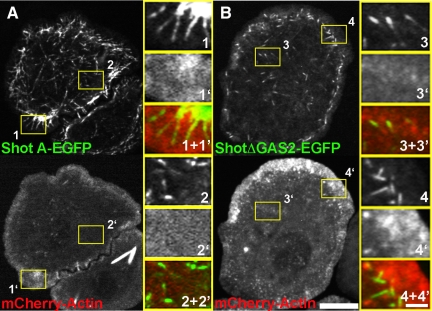
Figure 6.
Shot's lattice binding corresponds to peripheral actin-rich regions of the cell. (A) An S2 cell cotransfected with Shot A-EGFP (top) and mCherry-Actin (bottom). Regions shown at higher magnification (1–1′ and 2–2′) are indicated by the yellow boxes in lower magnification images. At the cell periphery (right, 1 and 1′), Shot is localizing along the length of the microtubules that have entered a region of increased actin fluorescent intensity. In contrast, in the cell interior (2 and 2′) Shot is restricted to the tips of microtubules where the actin fluorescent intensity is low. (B) An S2 cell transfected with ShotΔGAS2-EGFP (top) and mCherry-Actin (bottom). Regions shown at higher magnification are indicated with yellow boxes (3–3′ and 4–4′). ShotΔGAS2- EGFP fails to decorate along the length of microtubules in the cell interior (3 and 3′) or at the cell periphery despite the increased actin fluorescent intensity (4 and 4′). Bars, 10 μm (low-magnification images) and 2 μm (high-magnification images).

