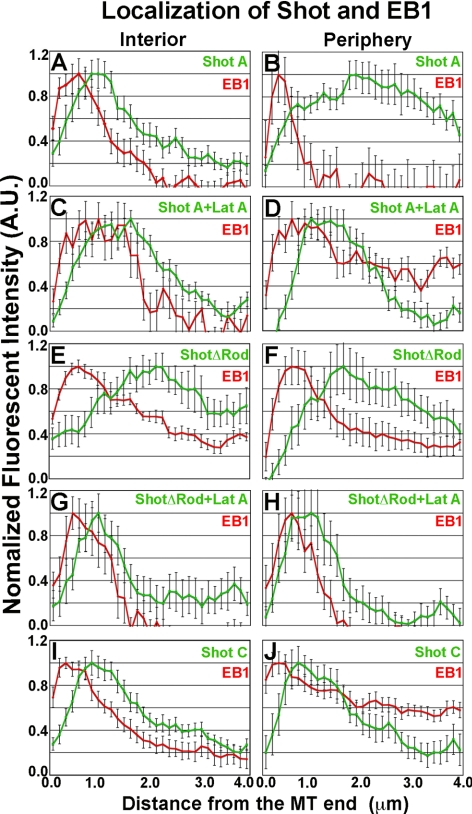
Figure 8.
Quantification of Shot's localization in the cell interior or at the cell periphery. Graphical representations of line scans of EB1(red) and Shot derivative fusion proteins (green) from images represented in Figure 7. For each graph, the average fluorescence intensity of 10–15 individual microtubules was plotted against the distance from the microtubule end. Two populations where measured, in the cell interior and at the cell periphery (1–5 μm in from the cell margin). (A–D) The distribution of full-length Shot and EB1 are quantified in the cell interior (A) and at the cell periphery (B) as well the resulting shift in distribution after perfusion with 250 nM Lat A (C and D). (E–H) Quantification of the distribution of EB1 and ShotΔRod before perfusion Lat A (E and F) and after the treatment (G and H). Quantified in I and J are the distributions of EB1 and the ShotC isoform in the cell interior (I) and periphery (J) after depletion of endogenous Shot by RNAi.

