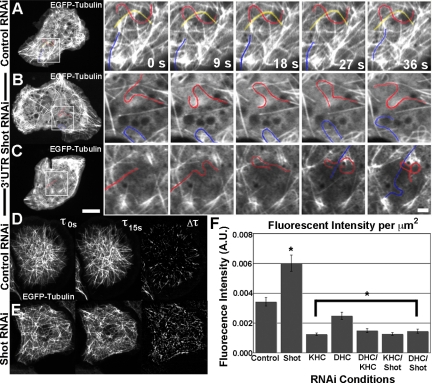
Figure 9.
Shot depletion leads to microtubule fish-tailing. (A–C) Time-lapsed stills of S2 cells transfected with EGFP-Tubulin after depletion by control RNAi (A) or 3′-UTR (B and C) of Shot. In lower magnification images (left), the region of higher magnification is indicated by white box. In higher magnification images (sequences to the right), individual microtubules are highlighted and followed over time. Bar, 10 μm (lower magnification images) and 2 μm (higher magnification images). (D and E) Method of quantification of the phenotype. In brief, S2 cells expressing mCherry-Tubulin were subtracted at 15-s intervals. The resulting fluorescence is an indicator of microtubule movement over the specified time period. This fluorescence was measured and normalized by size of the region of interest and quantified in F. (F) Quantification of fluorescence intensity per square micrometer after RNAi treatments. Asterisks indicate statistical significance as compared with control RNAi treated samples (p < 0.03, Student's t test) For each condition, five to 20 different cells were measured (a minimum of 80 data points); error bars represent SE.

