Figure 1.
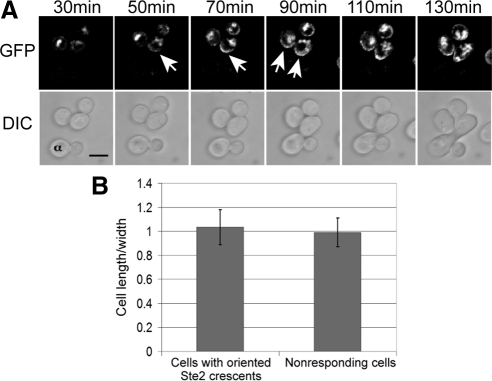
Receptor crescents form on the up-gradient side of the plasma membrane. (A) Wild-type MATa cells expressing Ste2-GFP (strain DMY169) were mixed with congenic MATα cells prestained with ConA-Alexa Fluor 594 (labeled α) and incubated on agar pads at 30°C for 30 min. Fluorescent (top) and DIC (bottom) images were then acquired every 20 min. Arrows indicate Ste2-GFP crescents. Bar, 5 μm. (B) Pheromone-induced morphogenesis. The bar graphs represent the mean ratio ± SD of cell length to maximal width. Two populations of cells were measured. For cells responding to a proximal mating partner, cell length was measured along the axis of polarity at the time point that the Ste2-GFP crescent was first visible (n = 36). As a control, randomly chosen nonresponding cells were measured along their vertical and horizontal axes (n = 36). There was no significant difference in the shape of the responding and nonresponding cells (p = 0.31).

