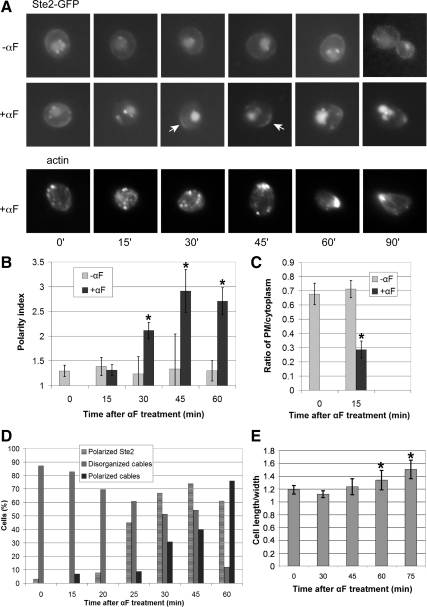
Figure 2.
Receptor localization in synchronized cells. (A) Representative fluorescent images of Ste2-GFP localization and F-actin in wild-type strain DMY169. G1-synchronized cells were treated with 30 nM α-Factor (αF) pheromone (0 time) or cultured without pheromone as indicated, and images were acquired every 15 min. Arrows indicate Ste2-GFP crescents. (B) Quantification of Ste2-GFP polarization. The degree of Ste2-GFP polarization in a given cell (the polarity index) was obtained by dividing the mean signal intensity in the brightest quarter of the plasma membrane by the mean signal intensity in the rest of the plasma membrane. The bar graphs represent the mean polarity index ± SD at each time point (n = 15). *p < 0.0001 for the comparisons of treated to untreated cells at each time point. (C) Ratio of plasma membrane to intracellular Ste2-GFP signal. The relative degree of Ste2-GFP membrane localization was obtained by dividing the mean fluorescence intensity at the plasma membrane by the mean fluorescence intensity inside the cell. The bar graphs represent the mean ratio ± SD of the plasma membrane to cytoplasmic signals at each time point (n = 15). *p < 0.0001 for the comparison treated to untreated cells. (D) Quantification of polarized actin cables. Cells stained with Alexa Fluor 594 Phalloidin (A, bottom line) were scored as having disorganized or polarized actin cables. The bar graphs represent the percentage of cells in each category at each time point (n ≥ 23); Cells in which actin cables were not detectable make up the remaining fraction of the population, and are not shown. The percentages of cells with clearly visible receptor crescents (polarity index ≥1.7) at each time point are also indicated on the graph (n ≥ 18). (E) Pheromone-induced morphogenesis. The bar graphs represent the mean ratio ± SD of cell length to maximal width (n = 20 for each time point). These cells did not significantly elongate until between 45 and 60 min after pheromone treatment (For the comparison treated to untreated cells, p = 0.142 at 45 min and *p < 0.0002 at 60 and 90 min.).

