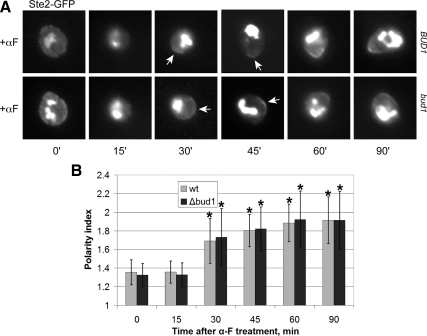
Figure 3.
Receptor localization in synchronized bud1Δ cells. (A) Representative fluorescent images of Ste2-GFP localization bud1Δ strain MSY163. G1-synchronized cells were treated with 30 nM α-Factor (αF) pheromone (0 time), and images were acquired every 15 min. Arrows indicate Ste2-GFP crescents. (B) Quantification of Ste2-GFP polarization. The degree of Ste2-GFP polarization in a given cell (the polarity index) was obtained as described in Figure 2. The bar graphs represent the mean polarity index ± SD at each time point (n = 15). *p < 0.0001 for the comparisons of treated to untreated cells at each time point.

