Figure 7.
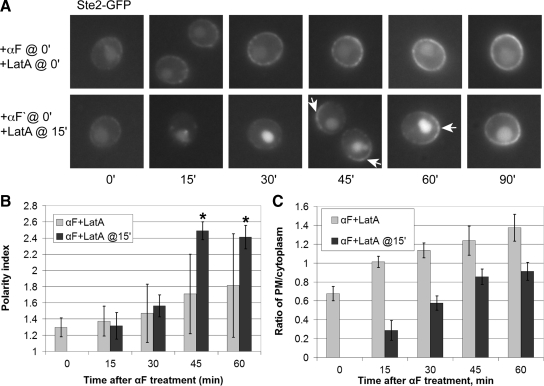
Polarization of nascent Ste2-GFP does not require polymerized actin after internalization has cleared the preexisting Ste2-GFP signal from the membrane. (A) Representative fluorescent images of Ste2-GFP localization in pheromone- and LatA-treated wild-type cells. G1-synchronized DMY169 cells were either concomitantly treated with 30 nM pheromone and 200 μM LatA (top row), or the LatA dose was added 15 min after pheromone treatment (bottom row). Images were acquired every 15 min. Arrows indicate Ste2-GFP crescents. (B) Quantification of Ste2-GFP polarization. The bar graphs represent the mean polarity index ± SD at each time point (n = 15). *p < 0.0001 for the comparisons of treated cells to 0 min. (C) Ratio of plasma membrane to intracellular Ste2-GFP signal. The bar graphs represent the mean ratio ± SD of the plasma membrane to cytoplasmic signals at each time point (n = 15).

