Figure 9.
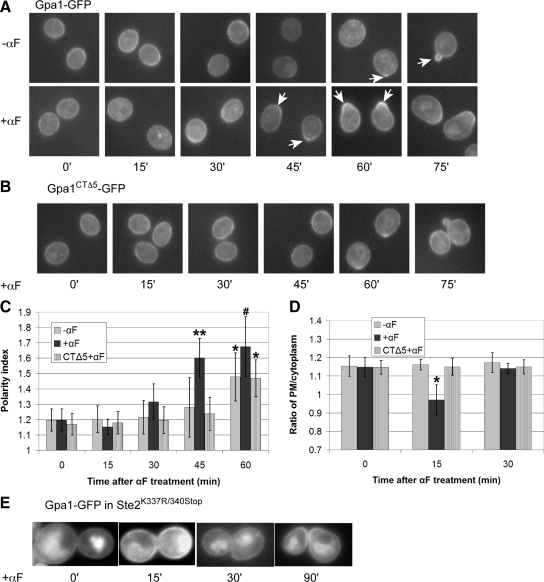
Pheromone-induced internalization and polarization of Gα (Gpa1) (A) Representative fluorescent images of Gpa1-GFP localization in wild type strain DSY257. G1-synchronized cells were treated with 30 nM pheromone (0 time) or cultured without pheromone, and images were acquired every 15 min. Arrows indicate Gpa1-GFP crescents. (B) Representative fluorescent images of Gpa1CTΔ5-GFP localization in gpa1Δ strain DMY238. G1-synchronized cells expressing Gpa1CTΔ5-GFP from a centromeric plasmid were treated with 30 nM pheromone (0 time), and images were acquired every 15 min. (C) Quantification of Gpa1-GFP and Gpa1CTΔ5-GFP polarization. The bar graphs represent the mean polarity index ± SD at each time point (n = 15). The Gpa1-GFP reporter displayed significant cell cycle dependent polarization in untreated cells (*p < 0.0001 for the comparison to 0 min) and polarized dramatically in response to the pheromone (**p < 0.0001 compared with 0 min and p < 0.0001 compared untreated cells at 45 min; #p < 0.0001 compared with 0 min and p < 0.01 compared with untreated cells at 60 min). Gpa1CTΔ5-GFP localization in treated cells was similar to Gpa1-GFP in untreated cells at all time points. (D) Ratio of Gpa1-GFP and Gpa1CTΔ5-GFP plasma membrane to intracellular reporter signals. The bar graphs represent the mean ratio ± SD of the plasma membrane to cytoplasmic signals at each time point (n = 15). *p < 0.0001 for the comparison treated to untreated cells. (E) Pheromone-induced Gα internalization and early polarization depends on receptor internalization. A mid-log phase culture of Ste2K337R/340Stop cells expressing Gpa1-GFP from a centromeric plasmid were treated with 30 nM pheromone (0 time) and imaged at the indicated time points. Representative fluorescent images are shown. None of the cells examined showed clear evidence of Gpa1-GFP internalization (n ≥ 50).

