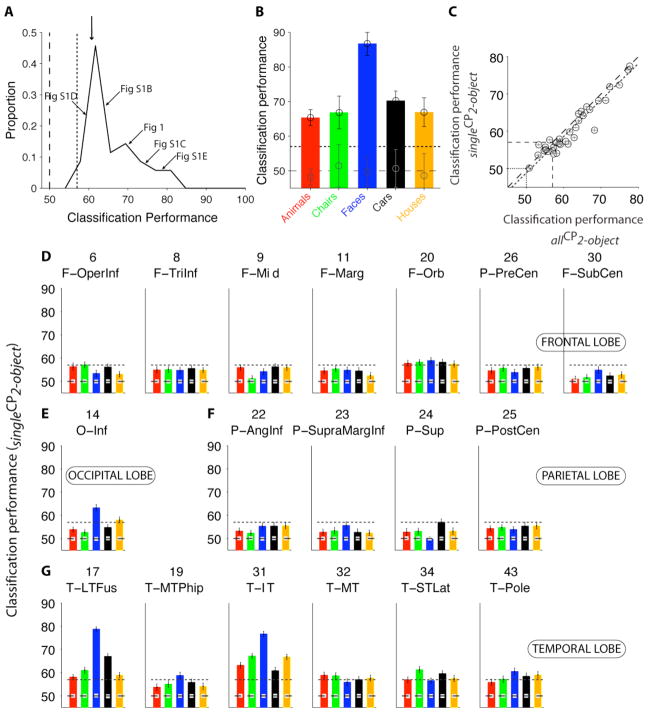
Figure 3. Decoding visual information in single presentations of two-object images.
A. Distribution of single-electrode classification performance (CP) values to decode category information in two-object images for all the electrodes that showed visually selective responses (n=24). The classifier was trained with single-object images and CP was evaluated using two-object images. The vertical dashed line indicates chance performance (50%) and the vertical dotted line indicates the significance criterion threshold based on shuffling object labels (Experimental Procedures). The arrows point to the examples from Fig. 1 and S1. The downward arrow shows the mean (60±4%). Bin size=2.5%. B. Classification performance for each category using a pseudopopulation containing 45 electrodes. Error bars denote one standard deviation over 20 iterations with random choices of units and repetitions for training the classifier (Experimental Procedures). The dashed line indicates chances levels and the dotted line shows the significance threshold. Gray circles show the mean CP for the shuffled labels condition. C. Comparison of the CP obtained upon training the classifier using one-object images and evaluating CP with the responses to two-object images (“singleCP2-object”, y-axis) versus training the classifier with the responses to two-object images and evaluating CP with different repetitions of two-object images (“allCP2-object”, x-axis; see also Fig. S5). We only included visually selective electrodes and selective categories. Error bars denote one SEM (20 randomizations of the repetitions used for training). The dashed line is the identity line and the dotted line is the linear fit to the data (35 categories, n=24 electrodes, ρ = 0.96). To compare singleCP2-object against allCP2-object independently of the number of training points, we randomly downsampled the examples with two-object images to match the examples with one-object images. D–G. For each location with ≥10 electrodes (Table S1), we built a pseudopopulation based on the entire data set. The responses of up to 45 electrodes in each location were concatenated. The format is the same as in Fig. 3B. The classifier was trained using one-object images and CP was evaluated using two-object images. Error bars indicate one SEM. The dashed line indicates chance levels (50%) and the dotted line indicates the statistical significance threshold. The gray squares indicate the average CP obtained from 100 random shuffles of the object labels. Table S1 describes the electrode locations and location abbreviations.

