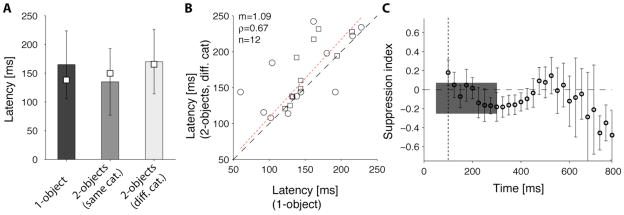
Figure 4. Response latencies and temporal evolution of the response suppression in two-object images.
We compared two possible definitions for the latency. Def1=first time point where the response to the preferred category exceeded by >20% the response to the non-preferred categories during at least 75 ms. Def2=first time point where a one-way ANOVA across object categories yielded p<0.01 for 15 consecutive time points. In both cases, the number of repetitions was randomly subsampled so that the number of 1-object repetitions was the same as the number of 2-object repetitions. A. Mean response latencies (bars=Def1; squares=Def2) for the visually selective electrodes. Error bars represent one standard deviation (Def1). There was no significant difference between the response latencies to one-object images (black bar) compared to two-object images (light bar) (two-tailed t-test p>0.3). B. There was a weak but significant correlation between the response latencies for one-object images (x-axis) and 2-object images (y-axis). Circles=Def1; Squares=Def2. The dotted line indicates a linear fit to the data for Def1. C. Mean response suppression as a function of time from stimulus onset. For each visually selective electrode, we computed the average IFP in bins of 25 ms and computed the suppression index in each bin as defined in Figure 2. Here we show the mean suppression index in each bin (error bars = SEM). The vertical dotted line denotes the image offset time (t=100 ms). The gray rectangle shows the mean±SD suppression index computed by considering the IFP response magnitude between 50 and 300 ms.

