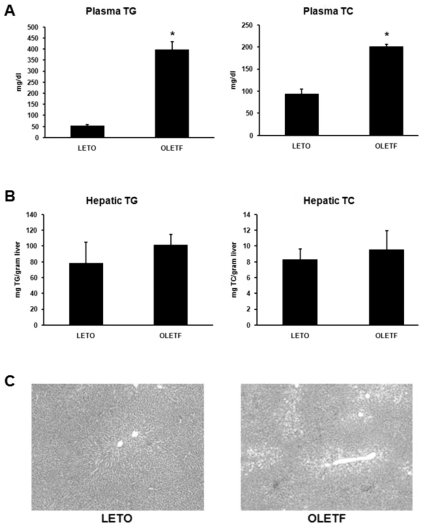
Fig. 2.
Analysis of lipid distribution. (A) Plasma TG and TC levels of OLETF and LETO rats. Plasma TG and TC levels were significantly higher in OLETF than LETO rats. (B) Hepatic TG and TC levels of OLETF and LETO rats. There were no significant differences in hepatic TG and TC levels between OLETF and LETO rats. (C) Hepatic histology of LETO and OLETF rats (H&E stain, ×40). Values represent means±SEM of LETO rats (n=10), and OLETF rats (n=10). *p<0.05 vs. LETO rats.

