Figure 4.

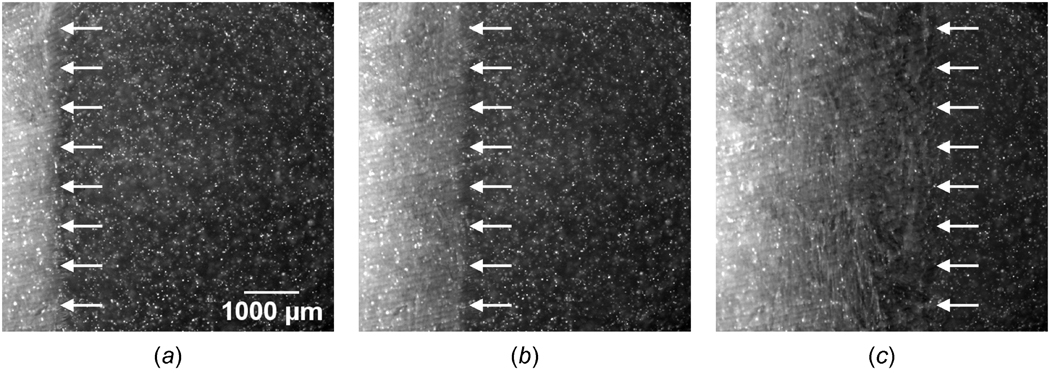
Fluorescence micrographs of engineered tissue when (a) X(t) ≈ 1000 µm, (b) X(t) ≈ 2000 µm, and (c) X(t) ≈ 4000 µm. The phase change interface, denoted by arrows, propagates from left to right while the tissue freezes one-dimensionally.

Fluorescence micrographs of engineered tissue when (a) X(t) ≈ 1000 µm, (b) X(t) ≈ 2000 µm, and (c) X(t) ≈ 4000 µm. The phase change interface, denoted by arrows, propagates from left to right while the tissue freezes one-dimensionally.