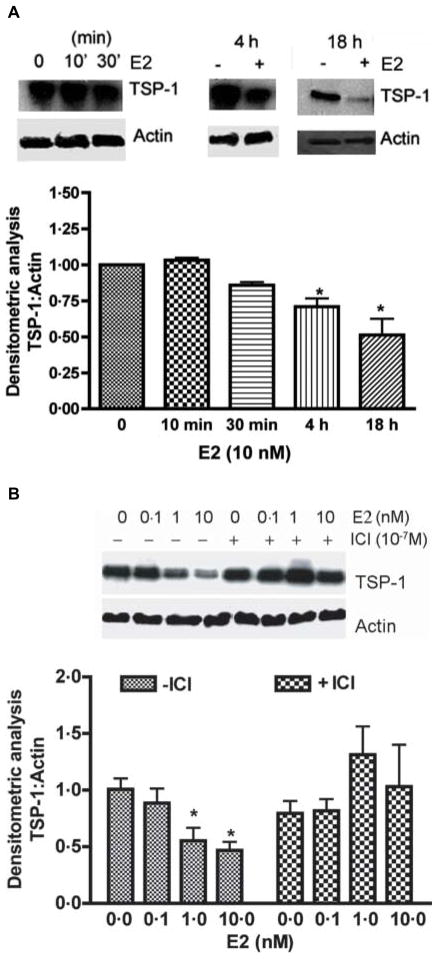
Figure 4.
Estradiol-induced changes in TSP-1 protein levels in pituitary endothelial cells in primary cultures. (A) Time-dependent effect of estradiol. Endothelial cells treated with estradiol (E2; 10 nM) for various time periods were lysed and used for detection of TSP-1 and actin levels using western blot. Upper panel in each figure shows representative bands for TSP-1 and lower panels shows the representative bands for actin. The mean ± S.E.M. ratios of band intensities of TSP-1 and actin are shown in the histograms. Each bar represents mean ± S.E.M. of four separate experiments. *P<0.05 compared with the control group. (B) Concentration-dependent effect of estradiol in the absence and presence of anti-estrogen ICI 182 780. Primary cultures of endothelial cells were pretreated with ICI 182 780 (10−7 M) for an hour followed by estradiol (0.1–10 nM) for 18 h. Levels of TSP-1 and actin were measured using western blot. Representative blots are shown in the upper panel. Data are shown on the lower panel. Each bar represents mean ± S.E.M. of 4–5 separate experiments.

