Fig. 5.
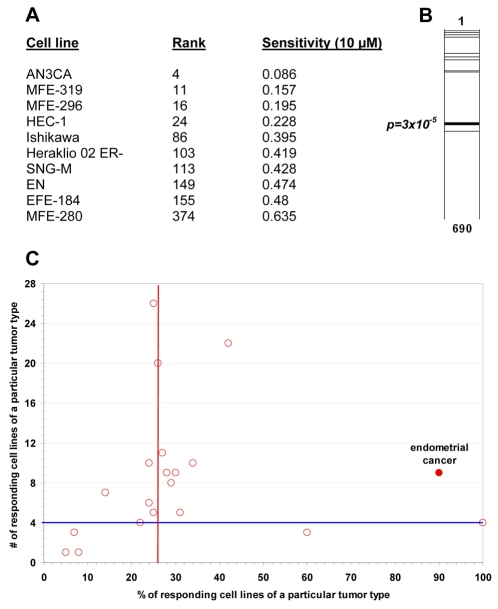
Endometrial cancer cell lines are especially sensitive to rapamycin. (A) Rank order of each endometrial cancer cell line (n=10) among a total of 690 cancer cell lines in the study. Sensitivity was calculated as the fraction of viable cells relative to untreated controls following treatment with 10 μM rapamycin. The P value was calculated as described in the methods section. (B) Graphical representation of ranks. Each horizontal bar represents the rank order position of a single endometrial cancer cell line among the 690 cell lines, except for the thick bar, which represents the median rank. Note that nine of the ten cell lines are in the top half. (C) Tumor type rapamycin sensitivity chart. Each circle corresponds to a tumor type (e.g. pancreatic, lung, breast). The vertical red line indicates the overall sensitivity of all cell lines (n=690) to the compound; i.e. 26% of human tumor-derived cell lines were sensitive to rapamycin (the criteria for sensitivity was >50% killing at a high concentration of the drug). The horizontal blue line at 4 on the y-axis is an empirically-derived gate indicating that, for any sensitivity to be considered meaningful, it has to occur in >4 cell lines of a particular tumor type. Tumor types in the top right-hand quadrant are thus more sensitive to the drug. The endometrial adenocarcinoma group at 90% (highlighted in red) includes all of the endometrial adenocarcinoma cell lines (n=10).

