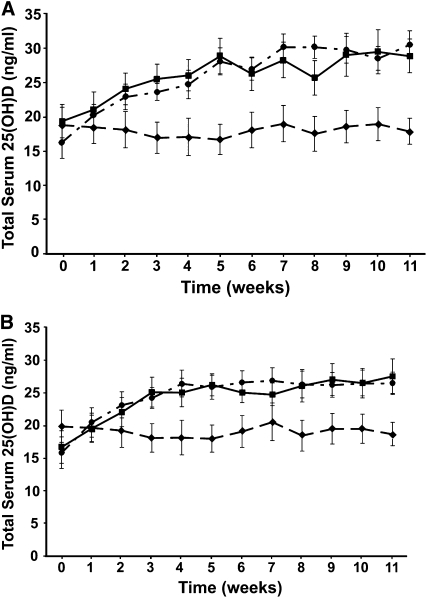
FIGURE 1.
A: Mean (±SEM) total 25-hydroxyvitamin D [25(OH)D] concentrations over time after the oral administration of 1000 IU vitamin D3 in orange juice (•; n = 18), 1000 IU vitamin D3 in capsules (▪; n = 20), or unfortified orange juice plus placebo capsules (♦; n = 15). No statistically significant differences were observed between areas under the curve for serum total 25(OH)D between the vitamin D3 in orange juice and vitamin D3 capsule groups (one-factor ANOVA, P = 0.084). B: Mean (±SEM) total 25(OH)D concentrations over time after oral administration of 1000 IU vitamin D2 in orange juice (•; n = 17), 1000 IU vitamin D2 in capsules (▪; n = 16), or unfortified orange juice plus placebo capsules (♦; n = 15). No statistically significant differences were observed between areas under the curve for serum total 25(OH)D between the vitamin D2 in orange juice and vitamin D2 capsule groups (one-factor ANOVA, P = 0.084).

