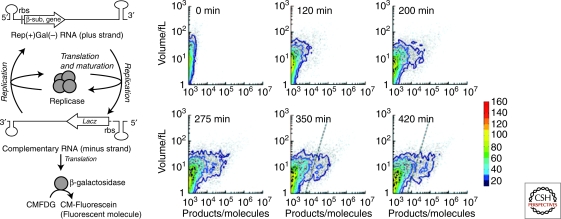
Figure 3.
Type 3 self-replication of genetic information in liposomes (A) Schematic representation of the reaction with an additional phenotype that was generated by insertion of the lacZ gene. The Qβ replicase β-subunit was encoded on the plus-strand RNA, and β-galactosidase was encoded on the minus-strand RNA (complement of the plus-strand RNA). Nonfluorescent CMFDG was hydrolyzed by β-galactosidase to yield green fluorescent product, CM-fluorescein. (B) Time course of the reaction analyzed by FACS. The results of 15000 liposomes. The results of FACS analysis of product (horizontal) and internal aqueous volume (vertical) of each liposome are shown. Dots represent the data of individual liposomes. Contour maps are overlaid. The frequency is depicted in color code. At 350 and 420 min, the reacted liposomes were defined as those with a substantial amount of products (right of the dashed lines).

