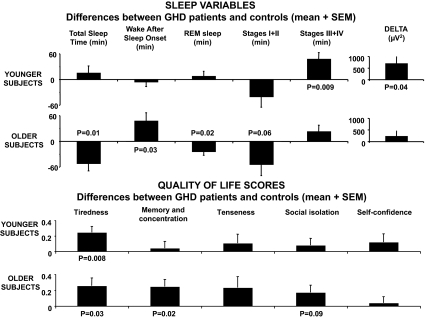
Figure 1.
Top panels, Differences (mean and sem) in total sleep time, sleep stages, and delta activity between 26 GHD patients with pure pituitary defects, pituitary defects with possible hypothalamic involvement, or childhood-onset idiopathic GHD, and their pair-matched healthy controls for the younger (n = 13) and older (n = 13) age groups. Positive values indicate higher levels in GHD patients and negative values lower levels in GHD patients. In each age group, P values denote the results of paired t tests between GHD patients and their matched controls. P ≥ 0.10 is not indicated. Bottom panels, Differences (mean and sem) in QoL scores for the five domains of the QoL-AGHDA scale between GHD patients with pure pituitary defects, pituitary defects with possible hypothalamic involvement, or childhood-onset idiopathic GHD, and their pair-matched healthy controls for the younger (n = 13) and older (n = 13) age groups. Positive values indicate higher levels in GHD patients. In each age group, P values denote the results of paired t tests between GHD patients and their matched controls. P ≥ 0.10 is not indicated.

