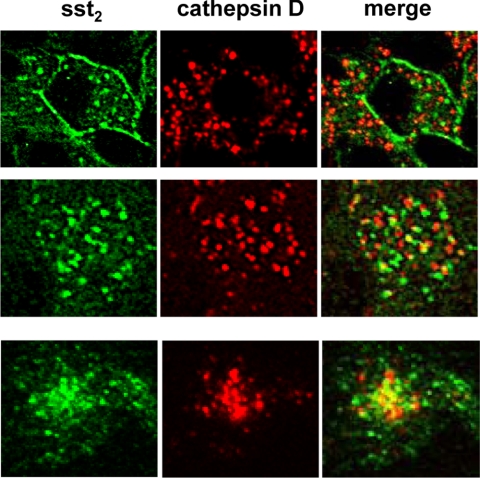
Figure 5.
Comparison of localization of internalized sst2 receptor with the lysosomal marker protein cathepsin D in tumor samples of octreotide-treated patients (top row, patient 5b; middle row, patient 3b) compared with [Tyr3] octreotide-treated, sst2-expressing HEK293 cells (bottom row, HEK-sst2) by confocal double-labeling immunofluorescence imaging. The left column (green) shows the internalized sst2 receptor visualized by the R2-88 antiserum, and the middle column (red) shows the lysosomal staining of cathepsin D. The merged images are shown in the right column. In both tissue samples and in the HEK-sst2 cells, the sst2 receptor shows only a minimal overlap with cathepsin D in the merged images (yellow structures), suggesting that upon agonist-stimulated sst2 receptor internalization, only few sst2 receptors are localized in lysosomal structures.

