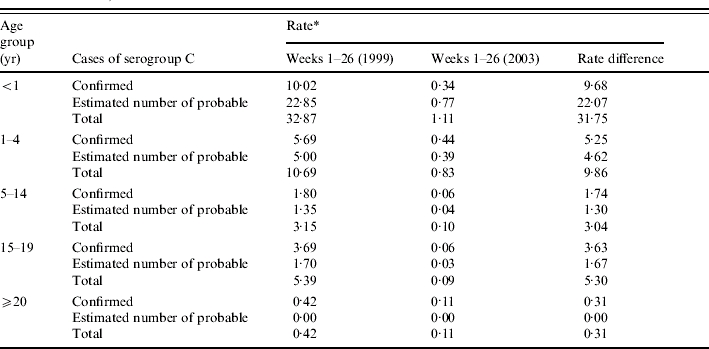
Table 4.
Rate of serogroup C meningococcal disease (confirmed and probable) by age group (weeks 1–26, 1999 and weeks 1–26, 2003)

Six-monthly rate is estimated per 100 000 population based on age-specific 2001 population estimates for England and Wales.
