

SUMMARY
Studying the epidemiology of pertussis and impact of differing vaccine schedules is difficult because of differing methods of case ascertainment. The advent of internationally standardized serological diagnosis for recent infection has allowed comparison of age-specific pertussis infection among European countries and was applied in Australia at the time of a major national epidemic. In 1997 and 1998, a nationally representative serum bank using residual sera from diagnostic laboratories was established. Measurement of pertussis toxin (PT) IgG level was conducted by a reference laboratory using an enzyme-linked immunosorbent assay standardized for a number of European countries. A titre of 125 EU/ml was interpreted as indicative of recent pertussis infection. The serological data were correlated with age, gender, region and disease epidemiology in Australia. The highest prevalence of recent pertussis infection was in the 5–9 years age group, and the lowest in 1–4 and 25–64 years age groups. In the 5–14 years age group, 29·7% (5–9 years) and 14·6% (10–14 years) of the sample had serological evidence of recent infection, correlating with the pattern of epidemic notifications. The 15- to 24-year-olds had similar high titres but the same notification rate as 25- to 44-year-olds, suggesting ascertainment bias may result in under-notification in the former age group. The prevalence of high titres observed was up to 20-fold higher than some European countries during a similar time period. Although vaccination has reduced the transmission of pertussis in the youngest and most vulnerable age group, pertussis is still endemic in Australia, particularly in older children and the elderly. The Australian vaccination schedule has been changed in an attempt to address this problem, by spacing doses more widely, with the fifth dose at 15–17 years of age. Seroepidemiology for pertussis offers the potential to compare patterns of pertussis between countries and examine the impact of vaccine schedule changes independent of notification and diagnostic bias.
BACKGROUND
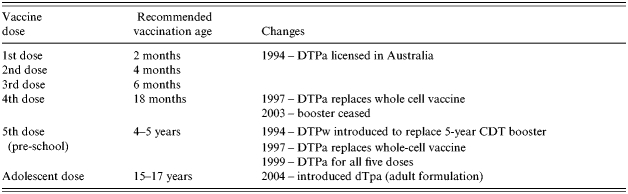
Australia had significant pertussis epidemics, associated with infant deaths, at approximately 3- to 4-year intervals in the decade since 1993 [1]. Universal childhood vaccination against pertussis commenced in Australia in 1953 with the introduction of the ‘triple antigen’ vaccine (locally produced whole-cell pertussis vaccine combined with the divalent diphtheria/tetanus vaccine to form DTP). The current Australian vaccination schedule has the primary DTP vaccinations given at 2, 4 and 6 months of age with a booster given at age 4–5 years, introduced in 1994 [1]. In 2004, the DTP booster given at 18 months since 1979 was removed and a booster at age 15–17 years introduced to control the increasing burden to pertussis in adolescents [2]. (See Table 1 for the changes in the last decade.)
Table 1.
Since 1993, changes in notification methods and increasing availability of non-culture diagnostic tests for pertussis (polymerase chain reaction and serodiagnosis using a whole-cell antigen assay) [3] have made it unclear how much of the reported increase reflected true changes in the underlying pattern of pertussis infection. One method of comparison over time is hospitalization data, as criteria for admission to hospital are likely to have changed less than diagnostic behaviour, and discharge coding for pertussis is reliable [4]. However, this has limitations, especially over the age of 2 years, when hospitalization for pertussis becomes rare.
Serological patterns can overcome this difficulty as they are applicable across the age spectrum, and serological studies have shown a high prevalence of exposure to pertussis in adults in a variety of settings [5–8]. In Spain, among persons aged 1–59 years the highest prevalence of high titre anti-pertussis antibodies [IgG PT and IgG-filamentous haemagglutinin (FHA)] occurred over 30 years of age with the lowest prevalence in those aged 5–12 years [7]. In the United States [5] a bimodal distribution in peak anti-pertussis antibody titres was found with the first peak in the 4–6 years age group, temporally corresponding to receipt of the fifth pertussis booster vaccination, with a smaller peak recorded in adolescents, attributed to natural infection following waning of vaccine-induced immunity. A major obstacle to international comparison has been the lack of standardization in pertussis serology. In 1996, the European Sero-Epidemiology Network (ESEN) was established, with the aim of performing population serosurveys for five vaccine-preventable diseases, which included pertussis. Methods of standardization of assays for IgG to pertussis toxin (PT IgG) have been developed by the ESEN group and applied to samples from Britain, Finland, France, Germany, The Netherlands, Sweden and Italy, the latter being the site of the ESEN reference laboratory [9]. This study reports pertussis serology, using the standardized ESEN methods, derived from a nationally representative serosurvey conducted in Australia, and compares this and Australian epidemiological data to the patterns of seroepidemiology observed in European countries with differing histories of pertussis vaccination.
METHODS
The sera used in this study were collected as part of the Australian National Serosurvey [10], which is a nationally representative sample of sera collected between 1997 to 1998 from people undergoing pathology tests in New South Wales (NSW), Victoria, Queensland, Western Australia (WA), South Australia (SA), Tasmania, the Australian Capital Territory (ACT) and the Northern Territory (NT). Data on age, state of residence and gender were collected. No clinical information regarding donors was available. No information was collected regarding donor's current or past vaccination status. Estimates of vaccination coverage of this population were based on data presented in a report from the National Centres for Immunisation Research and Surveillance of Vaccine Preventable Diseases [11]. The methods for the National Serosurvey are described elsewhere [10], and has been validated against a random community cluster sampling method for the testing of measles immunity, and found to be representative of the population [12]. Approval for the serosurvey was obtained from the Western Sydney Human Research Ethics Committee.
Sample size calculation
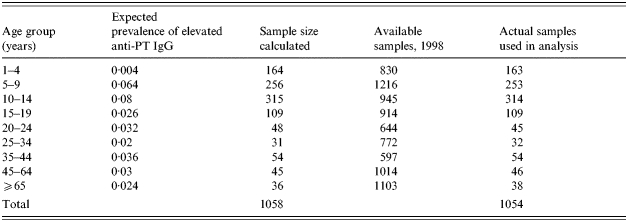
The number of sera for serological testing was calculated using Sample Size Determination in Health Studies [13]. Sample size calculations were performed using the expected age-group specific proportion of positive cases in the population. It was calculated to achieve 95% confidence intervals with a precision value of ±3% for <20-year-olds and ±5% for 20-year-olds. To represent the actual population, more females were selected in the ⩾65 years age group. Representation by state of serum collection, age and gender was based on mid-year estimate of the 1998 population [14]. The calculated total sample size and age-specific sample sizes were achieved (see Table 2 for the age-specific stratification).
Table 2.
Expected proportion of pertussis and calculated sample sizes by age
Serology
A total of 1054 sera were randomly selected from each age group from the available samples to fulfil the sampling requirements above, and were sent in dry ice to Italy by courier. Serological analysis was performed at the ESEN reference laboratory at the University of Palermo, Italy, Department of Hygiene and Microbiology. PT IgG levels were measured by an ESEN standardized enzyme-linked immunosorbent assay (ELISA) [9].
Statistical analysis of serological data
Serum samples were identified by postcode, gender and age at time of collection. Descriptive analysis was performed using Microsoft Excel 1997 [15] and Epi-Info version 6 [16]. The distribution of serological titres were non-parametric, so the anti-PT IgG titres were transformed using loge, the results were then averaged, with the exponential of this mean being the geometric mean titre (GMT), the measure of central tendency. A cut-off of 100 Dutch U/ml was used as an indicator of recent pertussis infection, as described previously by de Melker et al. [17]. In a non-epidemic period, using a population sample, de Melker et al., in The Netherlands, found that a single serum anti-PT IgG level of >100 Dutch U/ml (equivalent to 125 EU/ml) [9] was indicative of recent pertussis, but levels decayed rapidly, over time, with high levels lasting an average of 4·4 months [17]. The cut-off of 62·5 EU/ml anti-PT IgG was used as an indication of infection in the previous 12 months [17]. Additionally, anti-PT IgG titres were subdivided into four categories, <5 EU/ml (undetectable anti-PT IgG levels), 5–62·5 EU/ml (detection of anti-PT IgG antibodies suggesting infection at least 1 year previously or immunization), 62·5–125 EU/ml and >125 EU/ml, based on the study by the ESEN group published by Pebody et al. [18]. Standard errors bars are presented in Figures 1 and 2.
Fig. 1.

Geometric mean titre of anti-PT IgG by age, gender and notification rate.
Fig. 2.

Distribution of anti-PT IgG titres stratified by age.
When comparing ⩾2 populations, Bartlett's test for inequality was used to determine whether the populations were homogeneous. Kruskal–Wallis H and P value was used when the two populations being compared were non-parametric heterogenous groups. When the two non-parametric groups were homogenous, ANOVA statistics were employed.
Pertussis surveillance data
Data from the National Notifiable Diseases Surveillance System (NNDSS) were used to examine epidemiological trends in pertussis in the time periods corresponding the serosurvey [19]. Denominator data were obtained from the Australian Bureau of Statistics (ABS) population estimates [14]. Crude pertussis notification rates were calculated. Data from the same years as the serosurvey (1997 and 1998) as well as data from the years prior to it (1993–1996) were included.
RESULTS
A total of 1054 samples were analysed. There were approximately equal numbers of males (49·6%, 523/1054) and females (50·4%, 531/1054), with an average age of 16·24 years. The median age was 11 years and the mode was 12 years. The mean anti-PT antibody titre was 18·8 EU/ml with a median of 14·0 EU/ml. Antibody titres were related to age. The GMT by age group and age-specific notification rate are shown in Figure 1. The difference in mean anti-PT IgG titre by age group was significant (Kruskal–Wallis P=0·0046), with the highest GMT of 25·6 EU/ml occurring in the 5–9 years age group, and the lowest GMT (12·8 EU/ml) in the 1–4 years age group. The GMT was also high in the 15–24 and ⩾65 years age groups. The gender difference in GMT was greatest for the ⩾65-year-olds (6·9 EU/ml), followed by the 15–24 years age group (Fig. 1, standard error bars shown), although it never reached significance.
Figure 2 shows the frequency of anti-PT IgG titre quartiles stratified by age. The highest proportion of anti-PT IgG titres >125 EU/ml occurred in the 5–9 years age group, followed by the 10–14 and 15–24 years age group. No person in the 45–64 years age group reached an anti-PT IgG titre of >125 EU/ml. The 477 subjects who were aged ⩽10 years at the time of serum collection had a significantly higher (OR 1·57, 95% CI 1·10–2·26, P=0·013) prevalence of anti-PT IgG titres >125 EU/ml compared to those aged >10 years (15·9%, 76/477 vs. 10·7%, 62/577). In terms of infection in the previous 12 months, the highest prevalence of titres >62·5 EU/ml was for the 5–9 years age group, followed by the 15–24 and 10–14 years age groups respectively. Subjects aged ⩽10 years had a significantly higher prevalence (OR 1·41, 95% CI 1·04–1·93, P=0·028) of anti-PT IgG titres >62·5 EU/ml than subjects >10 years (21·6%, 103/477 vs. 16·3, 94/577 respectively). Prevalence of non-immune individuals (anti-PT IgG titre <5 EU/ml) was also age specific, with the highest prevalence occurring in the 1–4 years age group, followed by the 5–9 years age group. The gender difference in mean GMT was not apparent when looking at the proportion of subjects with high titres (>125 EU/ml). Overall, there was no significant difference in the prevalence of anti-PT IgG titres >125 EU/ml or >62·5 EU/ml by gender (P=0·31 and 0·61 respectively). Analysis of age-stratified data by gender also found no significant difference between males and females (data not shown).
The selected sera came from a representative sample of all states and territories (Table 3). The majority of the sera came from Eastern Australia (Vic, NSW, Qld), correlating with the large populations residing in this part of the country. The collection states were homogenous in terms of age at collection (Bartlett's P=0·79). However, the states and territories were heterogeneous in their mean anti-PT antibody titre (Bartlett's P=0·001). New South Wales (NSW) and the Australian Capital Territory (ACT), both on the east coast, combined had the highest average anti-PT IgG titre, followed by South Australia (SA) and the Northern Territory (NT). Western Australia (WA) had the lowest average anti-PT IgG.
Table 3.
Age at collection and antibody titre with respect to state of collection and year of peak pertussis notifications
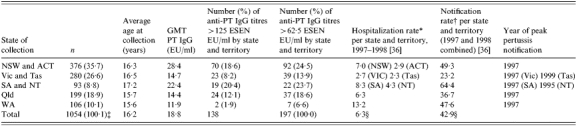
Per 100 000 population including <1-year-olds.
Per 100 000 population aged ⩾1 year old, average of 1997 and 1998 rates.
Rounding effect >100%.
Values represent Australian hospitalisation and average Australian notification rates for time period shown.
The average notification rates for 1997 and 1998, for cases aged >1 year old, are also shown in Table 1, with the highest rate occurring in SA and NT combined, followed by NSW and ACT combined. Victoria and Tasmania combined had the lowest average notification rate. All jurisdictions except for the NT had a pertussis epidemic during the time of serum collection in 1997. The NT had its peak in 1995, 2 years prior to the other states and territories.
Figure 3(a–c) graphically represents the frequency of anti-PT IgG titres >125 EU/ml in the Australian population used here, and in two Western European populations [18], which were respectively categorized as high (at least 90% of the population vaccinated against pertussis) vs. low vaccination coverage (<90% of the population has been vaccinated against pertussis). In Western Europe, those countries with lower vaccination coverage (England, West Germany, Italy) had the highest frequency of anti-PT IgG titres >125 EU/ml among those <10 years old, while those countries with high vaccination coverage (The Netherlands, France, East Germany, Finland) had a peak frequency in 10- to 24-year-olds. The Australian population had a higher frequency of anti-PT IgG titres >125 EU/ml than any European country, especially among 3- to 19-year-olds, while the 1- to 2-year-olds were similar. Thus, Australia had a mixed picture, with few titres >125 EU/ml in the very young, similar to high-vaccination-coverage countries, but a peak incidence occurring at a younger age. The Australian frequency then declined for those aged 25–64 years, with an apparent increase in frequency for the ⩾65-year-olds, as seen in the low-vaccination-coverage countries.
Fig. 3.

Proportion (%) of anti-PT IgG titres >125 ESEN EU/ml in (a) Australian population, (b) high-vaccination-coverage Western European countries and (c) low-vaccination-coverage Western European countries [18].
DISCUSSION
Pertussis continues to be endemic in Australia, despite the introduction of immunization. This serological survey gives us information that is not captured by disease notification data, mainly because the disease is under-notified in older children and adults [20]. The major finding of our study is that the burden of pertussis is greatest in the age groups 5–25 years and ⩾65 years. The problems of under-diagnosis and under-notification in these age groups ensure that pertussis remains endemic in the community, posing a risk to vulnerable infants, who are at greatest risk of morbidity and mortality from the disease. Serological surveys are valuable tools for assessing the current state of pertussis epidemiology, and allow evaluation of the impact of interventions in the future.
Pertussis vaccination was introduced into Australia in the 1940s, but was not widely implemented until 1953 when vaccines combined with diphtheria and tetanus became available. The Australian vaccination schedule for pertussis has undergone significant changes in the last decade (see Table 1), and currently consists of primary doses at 2, 4, 6 months, with boosters given at 4 years and 15–17 years. Vaccination coverage (including eligibility and schedule) varied with an individual's age. A report compiled by the National Centre for Immunisation Research and Surveillance of Vaccine Preventable Diseases (NCIRS) based on Australian Childhood Immunisation Register (ACIR) birth cohort data (for an explanation of the method, see reference [21]) shows that from January 1996 to December 1998, vaccination coverage for three primary DTP doses increased from an overall 75% to 85% [11]. Data concerning vaccination coverage prior to 1996 (the inaugural year of ACIR) was collected by the ABS, which underestimated coverage [1]. The percentage of children who were eligible for and received the preschool pertussis booster is not known, due to suboptimal data collection, however, information collected by agencies other than ACIR suggests vaccine uptake error of 89% in NSW [22]. Those of the ⩾65-year-old age group were not eligible for vaccination.
Age is an important factor in the epidemiology of pertussis. Vaccination has shifted the peak age of serological evidence of infection. Between 1993 and 1998, children aged ⩾14 years accounted for 51% of all notifications nationally, and the median age of notifications increased [1, 23]. In our study, subjects aged 5–14 years had the highest prevalence of high titres. Although some of this may be secondary to vaccination, with the Pebody et al. [18] study showing that some whole-cell vaccines may produce anti-PT IgG titres >125 EU/ml (see below). The low proportion of 1- to 4-year-olds with high titres may represent protection from infection through vaccination, which induces lower antibody responses than natural infection. Vaccination is likely to be a minor contributor. (Rather, the high prevalence of elevated pertussis titres in the 5–9 years age group likely reflects subsequent waning of immunity and re-infection.) The fifth DTP dose was introduced in Australia in 1994, meaning that all the subjects in this study aged between 5 and 9 years would have been eligible to receive this dose. However, due to the difficulties in ascertaining vaccination coverage described above, it is problematic to comment on the role the dose has on pertussis transmission. An Australian study looking at pertussis notification found that during 1996, despite an overall increase in pertussis notifications, the notification rate for 5- to 6-year-olds remained low, while the 8–9 years age group had the highest notification rate in that year [24]. This is consistent with a UK study which showed that immunization reduced transmission of pertussis [25].
The smaller peak in the prevalence of high titres in the ⩾65 years age group probably represents re-infection after waning immunity. This age group would not have been eligible for vaccination. Immunity against symptomatic disease afforded by vaccination has been described to last from 5 to 10 years [26] while that from natural infection lasts up to 20 years [27]. Over the last decade, the Australian notification rate of ⩾60-year-olds has increased from 11·7/100 000 in 1993–1998 to 15·4/100 000 in 1999–2000 [1, 28]. The cause for this increase in not entirely understood and may, in part, represent an increase in diagnosis through heightened doctor awareness. The data presented here identifies ⩾65-year-olds as having higher levels of pertussis infection and potentially disease. The growing role of grandparents as carers for young children identifies this group as a significant reservoir of infection for infants not yet immunized.
The data presented here are directly comparable to the European serosurvey by Pebody et al. [18] who reported endemicity of pertussis in six Western European countries, especially in adolescents, despite universal immunization programmes. Older children and adolescents (aged <20 years) had the highest prevalence of serological evidence of recent pertussis infection. High vaccination coverage (>90%) was associated with a reduction in serological evidence of recent pertussis infection among individuals aged <10 years old, with those aged 10–19 years having the highest proportion of high titres. In contrast, the European countries with low coverage had the highest prevalence of high anti-PT IgG in those aged 0–2 years, while adolescents had lower prevalence of high titres, meaning that those aged <10 years had the greatest prevalence of serological evidence of infection. Additionally, they reported evidence for waning immunity from immunization and natural infection, and subsequent re-infection. Finally, the effect of the type of vaccine received on post-vaccination anti-PT IgG titres were examined, with high titres being measured at 4–6 weeks following whole-cell and at acellular vaccines produced by Aventis–Pasteur (Sanofi Aventis, Paris, France) given to infants, and at whole-cell (Aventis–Pasteur) and acellular [Aventis–Pasteur, Chiron Biocine (Emeryville, CA, USA) and Wyeth–Lederly (Madison, NJ, USA)] vaccines given at 4–5 years of age [18].
Australia shares characteristics of pertussis epidemiology with both high- and low-vaccine- coverage countries in Europe. In the data presented here, pertussis was similarly found to be endemic. However, while epidemiological data from pertussis outbreaks demonstrates an increase in the medium age of notified cases, [1, 23] it remains that those aged <10 years are subject to heavy pertussis transmission, with a significantly higher incidence of high anti-PT IgG titres compared to those aged ⩾10 years. In terms of anti-PT IgG titres >125 EU/ml, Australia had the highest frequency of high titres, over double that of any of Western European country in the European study. There are two reasons for this. There was an Australian-wide pertussis epidemic in 1997, with a total of 10 907 notified cases, which followed a prolonged period of elevated notifications since 1993 [1]. Additionally, in 1996 to 1998, a locally made whole-cell vaccine was scheduled for 18-month-olds and preschoolers. A paper by Stewart et al. [29] which examined the anti-PT-IgG response to the receipt of the three primary doses of DTP whole-cell vaccine, found that the titre increased by ∼fivefold. However, due to different assays used it is not clear whether this result is equivalent to an ESEN result of >125 EU/ml, although the high notification numbers for the 5- to 9-year-olds suggests the vaccine effect is mild. Pebody et al. demonstrated that a high proportion of anti-PT IgG titres >125 EU/ml 4–5 weeks after whole-cell vaccines had been administered [18]. This presumably would have a similar effect on older children. In contrast, Pebody et al. showed that the acellular vaccine produced by GlaxoSmith Kline–Glaxo Wellcome UK Ltd (Uxbridge, Middlesex, UK), which was used in the primary course elicited only a small percentage (8·8%) of high titres [18].
We described considerable geographic variation in the seroepidemiology of pertussis. We found some correlation between seroepidemiology and notification by state, but this did not explain all the differences. Population density is an important factor in the transmission of pertussis, with transmission being dependent on proximity [30]. It is not unexpected that the area with the highest population density (NSW) had the highest prevalence of serological evidence of infection. Additionally, the small sample sizes from the ACT, NT and Tasmania, as well as the relative isolation of the last two regions, may be responsible for part of this discrepancy, with NT and Tasmania having epidemics at different times to the rest of Australia (see Table 3).
Despite the female predominance of pertussis notifications in the period covered by the study, we found no significant gender-specific differences in anti-PT IgG titres, consistent with other serosurveys [6, 7]. Gender-specific differences in pertussis notification has been described in epidemics in Australia and internationally [1, 27, 31, 32]. In Australia, between 1993 and 1998 the male:female ratio for notified pertussis cases was 1:1·2 [1]. The reasons for the discrepancy in gender predominance between notified and serologically confirmed pertussis cases are not clear but may be related to gender-specific differences in the likelihood of notification of cases, presentation for medical consultation, or the development and severity of symptoms due to infection.
This study has several limitations. The sample size calculations were based on the population size of each region, and the expected rate of pertussis infections in each age group, leading to small sample sizes from ACT, Tasmania and NT, as well as in the higher end of the age range. This could overestimate actual anti-PT IgG titres in those populations, exaggerating the importance of pertussis. Differences in the population from each state and territory in terms of age may confound the prevalence of pertussis infection. The sera used were not from a random community-based sample, but an opportunistic collection from laboratories around Australia [10], potentially skewing the data towards a sicker population. However, the serological trends reported here were consistent in many aspects with serosurveys done internationally on ‘healthy’ individuals [7, 8], and the methods used here have been validated for measles against a prospective, cluster-sampling method which were found to be representative [12]. The vaccination status of subjects was unknown, and whilst it is possible to estimate vaccination coverage of this representative population, this is limited for the older age groups. No information regarding the clinical picture of individuals whose sera were used here was collected. While serology can elucidate pertussis transmission, it has not been possible to use it as a measure of disease burden. A recent study by Horby et al. [33] on students involved in a pertussis outbreak in a Sydney boarding school showed that GMT correlated with symptom severity, suggesting that the serological cut-offs used here were associated with a significant disease burden. Studies have demonstrated the large economic burden that pertussis places both on the individual and family, as well as the community at large [34, 35].
Vaccination has reduced the transmission of pertussis in the youngest and most vulnerable age group, however, pertussis is endemic in Australia, particularly in older children and the elderly. The limited duration of immunity afforded by vaccination with subsequent infection/re-infection, sustains the circulation of pertussis within the Australian community. The recent change in the Australian vaccination schedule, with movement of the fourth dose of pertussis vaccine from 18 to 48 months and the final dose to 15–17 years of age in 2004 attempts to address this problem. A sustained effort needs to be made to ensure vaccination coverage remains above 90% for the benefits of herd immunity, and this study suggests that future serosurveys have a role in the evaluation of the impact of this intervention on pertussis epidemiology in Australia.
DECLARATION OF INTEREST
None.
REFERENCES
- 1.McIntyre P et al. Vaccine preventable diseases and vaccination coverage in Australia, 1993–1998. Communicable Diseases Intelligence. 2000;24:22–26. [PubMed] [Google Scholar]
- 2.National Health and Medical Research Council. The Australian Immunisation Handbook. 8th. Canberra: Australian Government Publishing Service; 2003. Pertussis; pp. 205–217. , pp. [Google Scholar]
- 3.Poynten M et al. Serological diagnosis of pertussis: evaluation of IgA against whole cell and specific Bordetella pertussis antigens as markers of recent infection. Epidemiology and Infection. 2002;128:161–167. doi: 10.1017/s0950268801006598. [DOI] [PMC free article] [PubMed] [Google Scholar]
- 4.Bonacruz-Kazzi G et al. Diagnostic testing and discharge coding for whooping cough in a children's hospital. Journal of Paediatrics and Child Health. 2003;39:586–590. doi: 10.1046/j.1440-1754.2003.00244.x. [DOI] [PubMed] [Google Scholar]
- 5.Cattaneo LA et al. The seroepidemiology of Bordetella pertussis infections: a study of persons aged 1–65 years. Journal of Infectious Diseases. 1996;173:1256–1259. doi: 10.1093/infdis/173.5.1256. [DOI] [PubMed] [Google Scholar]
- 6.Deville JG et al. Frequency of unrecognized Bordetella pertussis infections in adults. Clinical Infectious Diseases. 1995;21:639–642. doi: 10.1093/clinids/21.3.639. [DOI] [PubMed] [Google Scholar]
- 7.Garcia-Corbeira P et al. Seroepidemiology of Bordetella pertussis infections in the Spanish population: a cross-sectional study. Vaccine. 2000;18:2173–2176. doi: 10.1016/s0264-410x(00)00029-3. [DOI] [PubMed] [Google Scholar]
- 8.Giammanco A et al. Seroepidemiology of pertussis in Italy. Reviews of Infectious Diseases. 1991;13:1216–1220. doi: 10.1093/clinids/13.6.1216. [DOI] [PubMed] [Google Scholar]
- 9.Giammanco A, Chiarini A, Maple PA. European Sero-Epidemiology Network: standardisation of the assay results for pertussis. Vaccine. 2003;22:112–120. doi: 10.1016/s0264-410x(03)00514-0. [DOI] [PubMed] [Google Scholar]
- 10.Gidding H. Australia's national serosurveillance program. NSW Public Health Bulletin. 2003;14:90–93. doi: 10.1071/nb03027. [DOI] [PubMed] [Google Scholar]
- 11.McIntyre P et al. Vaccine preventable diseases and vaccination coverage in Australia, 1993–1998. Communicable Diseases Intelligence. 2000;24:53–67. [PubMed] [Google Scholar]
- 12.Kelly H et al. A random cluster survey and a convenience sample given comparable estimates of immunity to vaccine preventable diseases in children of school age in Victoria, Australia. Vaccine. 2002;20:3130–3136. doi: 10.1016/s0264-410x(02)00255-4. [DOI] [PubMed] [Google Scholar]
- 13.Lwanga SK, Lemeshow S. Sample Size Determination in Health Studies: A Practical Manual. Geneva: World Health Organization; 1991. [Google Scholar]
- 14.ABS Australian Demographic Statistics.Australian Bureau of Statistics; 2001 [Google Scholar]
- 15.Microsoft Corporation INSO Corporation; 1993. . Microsoft® Excel 97. [Google Scholar]
- 16.CDC Atlanta: Centers for Disease Control and Prevention; 1999. . Epi-Info™ version 6. [Google Scholar]
- 17.de Melker HE et al. Specificity and sensitivity of high levels of immunoglobulin G antibody against pertussis toxin in a single serum sample for diagnosis of infection with Bordetella pertussis. Journal of Clinical Microbiology. 2000;38:800–806. doi: 10.1128/jcm.38.2.800-806.2000. [DOI] [PMC free article] [PubMed] [Google Scholar]
- 18.Pebody RG et al. The seroepidemiology of Bordetella pertussis infection in Western Europe. Epidemiology and Infection. 2005;133:159–171. doi: 10.1017/s0950268804003012. [DOI] [PMC free article] [PubMed] [Google Scholar]
- 19.Communicable Diseases Network – Australia New Zealand 2000. . National Notifiable Diseases Surveillance System, 12 December .
- 20.Orenstein WA. Pertussis in adults: epidemiology, signs, symptoms, and implications for vaccination. Clinical Infectious Diseases. 1999;28:S147–S150. doi: 10.1086/515061. (Suppl 2): [DOI] [PubMed] [Google Scholar]
- 21.O'Brien ED, Sam GA, Mead C. Methodology for measuring Australia's childhood immunisation. Communicable Disease Intelligence. 1998;22:36–37. [PubMed] [Google Scholar]
- 22.Lister S et al. Immunisation coverage in Australian children: a systematic review 1990–1998. Communicable Diseases Intelligence. 1999;23:145–170. [PubMed] [Google Scholar]
- 23.Scheil W et al. Pertussis in South Australia 1893 to 1996. Communicable Diseases Intelligence. 1998;22:76–80. [PubMed] [Google Scholar]
- 24.Andrews R, Herceg A, Roberts C. Pertussis notification in Australia, 1991 to 1997. Communicable Diseases Intelligence. 1997;21:145–148. [PubMed] [Google Scholar]
- 25.Rohani P, Earn DJD, Grenfell BT. Impact of immunisation on pertussis transmission in England and Wales. Lancet. 2000;355:285–286. doi: 10.1016/S0140-6736(99)04482-7. [DOI] [PubMed] [Google Scholar]
- 26.Jenkinson D. Duration of effectiveness of pertussis vaccine: evidence from a 10 year community study. British Medical Journal. 1988;296:612–614. doi: 10.1136/bmj.296.6622.612. [DOI] [PMC free article] [PubMed] [Google Scholar]
- 27.Wirsing von Konig CH et al. Pertussis in adults: frequency of transmission after household exposure. Lancet. 1995;346:1326–1329. doi: 10.1016/s0140-6736(95)92343-8. [DOI] [PubMed] [Google Scholar]
- 28.Marchant CD et al. Pertussis in Massachusetts, 1981–1991: incidence, serologic diagnosis, and vaccine effectiveness. Journal of Infectious Diseases. 1994;169:1297–1305. doi: 10.1093/infdis/169.6.1297. [DOI] [PubMed] [Google Scholar]
- 29.Stewart TA et al. Antibodies to diphtheria, tetanus and pertussis before and after immunization with DTP (Triple Antigen) vaccine. Journal of Paediatrics and Child Health. 1996;32:378–381. doi: 10.1111/j.1440-1754.1996.tb00933.x. [DOI] [PubMed] [Google Scholar]
- 30.Fine PEM. Herd immunity: history, theory, practice. Epidemiologic Reviews. 1993;15:265–302. doi: 10.1093/oxfordjournals.epirev.a036121. [DOI] [PubMed] [Google Scholar]
- 31.Jenkinson D. Natural course of 500 consecutive cases of whooping cough: a general practice population study. British Medical Journal. 1995;310:299–310. doi: 10.1136/bmj.310.6975.299. [DOI] [PMC free article] [PubMed] [Google Scholar]
- 32.Mertsola J et al. Intrafamilial spread of pertussis. Journal of Pediatrics. 1983;103:359–363. doi: 10.1016/s0022-3476(83)80403-x. [DOI] [PubMed] [Google Scholar]
- 33.Horby P et al. A boarding school outbreak of pertussis in adolescents: value of laboratory diagnostic methods. Epidemiology and Infection. 2005;133:229–236. doi: 10.1017/s0950268804003401. [DOI] [PMC free article] [PubMed] [Google Scholar]
- 34.Pichichero ME, Treanor J. Economic impact of pertussis. Archives of Pediatric and Adolescent Medicine. 1997;151:35–40. doi: 10.1001/archpedi.1997.02170380039006. [DOI] [PubMed] [Google Scholar]
- 35.Thomas PF, McIntyre PB, Jalaudin BB. Survey of pertussis morbidity in adults in Western Sydney. Medical Journal of Australia. 2000;173:74–76. doi: 10.5694/j.1326-5377.2000.tb139246.x. [DOI] [PubMed] [Google Scholar]
- 36.McIntyre P et al. Vaccine preventable diseases and vaccination coverage in Australia, 1993–1998. Communicable Diseases Intelligence. 2000;24:71–78. [PubMed] [Google Scholar]