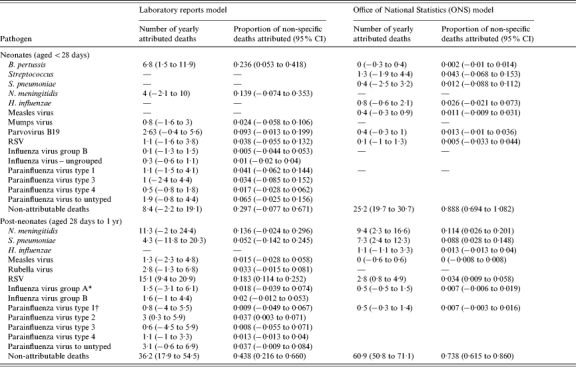
Table 4.
Yearly numbers of deaths and proportions of deaths with unknown cause attributed to specific pathogens as estimated from the two models in comparison

The laboratory reports data presented are for influenza virus by group while the ONS data are for influenza virus all groups.
The laboratory reports data presented are for parainfluenza virus by type while the ONS data are for parainfluenza virus all types.
