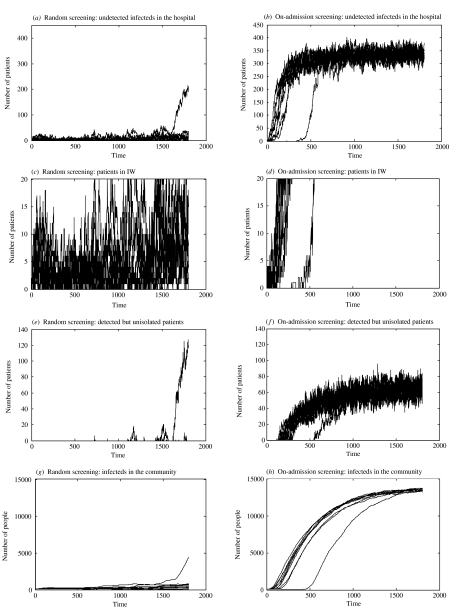
Fig. 4.
Simulations of 10 epidemics over 1800 days (∼5 years) with an IW of capacity 20. Random screening (φ=0·087) is shown in the left hand panels and on-admission screening (ω=0·7) on the right. The four rows examine: hospital prevalence; number of patients in IW, number of DNISO patients and community prevalence. All other parameters are set to the values in Table 1.

