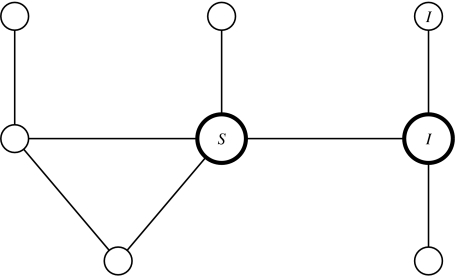
Fig. 1.
An example of a simple mixing network. Individuals are represented by circles, partnerships by lines. The infection status of three individuals is included for illustration. The two highlighted individuals contribute 1 towards [SI], the number of susceptible–infected partnerships; along with the individual top right they comprise a SII triple.

