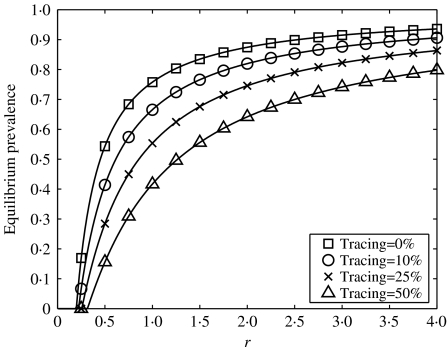
Fig. 2.
Equilibrium prevalence plotted against the infection parameter, r, for a range of tracing fractions, f, in a single-step tracing model, g=1 throughout, with r varied by altering τ. A heterogeneous network was used to parameterize the model, with individuals of neighbourhood size ranging from 1 to 13.

