SUMMARY
Wild boars are important disease reservoirs. It is well known that abundance estimates are needed in wildlife epidemiology, but the expense and effort required to obtain them is prohibitive. We evaluated a simple method based on the frequency of faecal droppings found on transects (FBII), and developed a spatial aggregation index, based on the runs test statistic. Estimates were compared with hunting data, and with porcine circovirus and Aujeszky’s disease virus seroprevalences and Mycobacterium tuberculosis complex and Metastrongylus spp. prevalence. The FBII and the aggregation index were correlated with the hunting index, but both of the former estimates correlated better than the latter with the disease prevalences. Hence, at least in habitats with high wild boar densities, the FBII combined with the aggregation index constitutes a cheap and reliable alternative for wild boar abundance estimation that can be used for epidemiological risk assessment, even outside the hunting season and in areas with no available data on hunting activities.
INTRODUCTION
The European wild boar (Sus scrofa L., 1758) and its semi-domestic relative, the feral pig, are currently increasing in distribution throughout Europe and other parts of the world [1–3], the former being the most widely distributed wild ungulate in the Iberian Peninsula [4], where both its range and density are still increasing [5].
Wild boars – and feral pigs – are considered as important disease reservoirs, creating concern regarding the efforts to control infectious diseases such as swine fever [6]. In Spain, the wild boar is suspected of playing a role in the epidemiology of other viral agents such as Aujeszky’s disease virus (ADV) [7], and of bacteria such as the Mycobacterium tuberculosis complex (MTBC) [8], among other relevant disease agents. It has been repeatedly suggested that the prevalence of such diseases could be related to farm-like management schemes, causing overabundance and increasing aggregation, for example at water-holes or feeding sites [9]. In central and southern Spain, a high proportion of the hunting estates are high-wire fenced, artificial feeding is common, and according to direct interviews, the wild boar density ranges from 1·2 individuals/km2 to 90·9 ind/km2.
It is well known that abundance estimates are needed to study the epidemiology of wildlife diseases [10]. Unfortunately, the expense and effort required to estimate the true population size are prohibitive [11]. Methods include direct observation (day or night) of individuals. On the other hand, indirect methods, often referred to as population or abundance indices (or activity indices), do not rely on directly seeing or hearing animals, but merely noting some form of ‘signs’ that indicate the animals have been in the area (e.g. faecal counts). In the wild boar, methods based on direct observations are particularly limited due to its nocturnal activity and to the absence of a reflecting tapetum lucidum, which helps to detect other mammals in spotlight counts. Methods already used to estimate wild boar abundance include capture–recapture [12–14], indirect indices [15–17], line transect surveys [18], and even direct observation at feeding sites [19]. The most widely employed method is based on hunting effort and hunting bags [20–22]. This method has a number of limitations, since it can only be used during the hunting season, it is not available in peri-urban or protected areas where the impact of hunting is low, and it requires large sampling units to limit hunter-related bias [23]. As a general rule, high sampling is required to reduce estimate variation.
Ideally, these methods should provide information not only on abundance, but also on spatial aggregation, since use of indirect indices is even more relevant in disease surveillance and control schemes. Any method based on indirect indices of abundance must be tested for the effect of habitat and season, and should have a linear relationship with other abundance estimates, as well as with independent variables of biological meaning.
Recently, Vicente et al. [9] developed a simple method for estimating relative abundances of wild boar in Mediterranean habitats, and used it successfully to study the epidemiology of porcine circovirus type 2 (PCV2) in Spain. This method is based on the frequency of faecal droppings found on transects. The first aim of this study was to evaluate the relationship between abundance estimates while controlling by season and habitat, and refine the method in order to calculate a spatial aggregation index. Second, we aimed to compare the data with hunting bag results across a number of hunting estates, and test the estimates for relationships with the prevalence of four direct and indirect transmitted diseases.
MATERIAL AND METHODS
Sampling sites
The evaluation of seasonal population variation and habitat effects on this estimation method was conducted in a 723 ha fenced hunting estate in the province of Ciudad Real, South central Spain (UTM 30S 387400–4308561). The habitat is Mediterranean and characterized by evergreen oak (Quercus ilex) scrublands (67% of the estate) with scattered pastures and small crops (33% of the estate) conforming dehesas (savannah-like habitats). The climate is Mediterranean (annual rainfall in 2002, 406·3 mm; annual mean temperature in 2002, 15·3°C). Wild boar is autochthonous to this area. An independent estimate of wild boar abundance was performed by means of direct counts at feeding sites in summer, a critical season for food availability, ranging from 10·6 ind/km2 to 29·6 ind/km2. Wild boar management is based on supplementary feeding during the study period.
Another 38 sampling sites considered as representative of the Mediterranean scrublands of the central and southern regions of Spain, where hunting activities are important (UTM 30S 251300–496900; 4162100–4382500), were selected to test the method. These sites are characterized by variable densities of wild boars, but these are generally high due to intensive big-game management and are frequently in excess of the natural carrying capacity threshold. In an effort to replicate the current management types in southern Spain, nine of the sites consisted of open areas, while 25 where fenced estates, and four were intensive farm-like managed estates.
The frequency-based method
Vicente et al. [9] used wild boar droppings to estimate relative abundances of this ungulate. In one study site we repeated these estimates monthly from April 2002 to April 2003 (n=13, without cleaning the transects) to study the effects of season and habitat (grasslands and scrublands). Regarding the second aim of this study, in order to avoid any seasonal effect, the survey of all 38 sites was carried out in September 2002. Habitat effects on the aggregation index were not evaluated since this was calculated for each locality, and not for each habitat type.
Wild boar droppings are dark cylinders or aggregates of pellets that vary in size, have a characteristic smell, and contain large amounts of poorly digested vegetable matter [24, 25]. The survival time of faecal droppings depends on the meteorological circumstances [26, 27]. Thus, in order to maximize the method’s sensitivity to small density changes, we used all (fresh and old) droppings in our survey. The observer effect was minimized by performing the sign transects with a reduced team of observers with experience in this kind of fieldwork.
As described in Vicente et al. [9], each count consisted of 40 transects of 100 m length and 1 m width, divided into 10 sectors of 10 m length. Transects were stratified by habitat type [28], and avoided roads and other singular features. Habitat was characterized every 200 m. Sign frequency was defined as the average number of 10-m sectors with wild boar droppings. Based on these frequencies we calculated the frequency-based indirect index (FBII):
 |
where Si is the number of sign-positive sectors in the ith 100-m transect (i.e. Si varies between 0 and 10), and n is the number of transects considered (i.e. n=40 for the total analysis).
In order to calculate an aggregation index we transformed the sign-frequency data according to the runs test statistic [29]:
 |
where r=observed number of runs, μr=expected r under randomness, σr=variance,
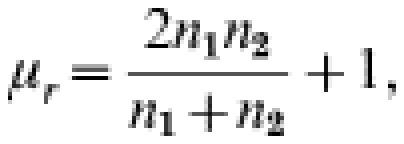 |
 |
where n1=number of sampling units with droppings present and, n2=number of sampling units with droppings absent.
The Z statistic counts if the runs of wild boar signs in the lined up npresent+nabsent sectors (i.e. 40×10 for the complete data) are found at random, defining one run for each series of sectors with the same result (present or absent). We used the absolute value of Z (Z has a normal distribution [29]) as the index of sign aggregation discarding the discrimination between aggregated and over-dispersed signs because the latter is not expected to occur in our situation.
We selected a relatively small fenced estate to study the effect of population and habitat seasonal variations on the estimation method used because of a logistic point of view, as more reliable direct censuses at feeding sites could be obtained. Furthermore, (i) habitat structure (and plant phenology) in this estate closely resembles that of the study area, (ii) wild boars are similarly native to this area so that similar habitat use is expected, and (iii) management design is similar across the study estates (differences mainly related to the intensity of its application), thus, a similar response of the estimation method to wild boar abundance variation is expected in the rest of the study populations.
Other abundance indices
Direct censuses at feeding sites [30], as well as extrapolations based on these counts and data on hunting harvest and reproduction, were used to compare with the FBII at the first study site. Feeding-site counts were carried out in September 2001, July and August 2002, and September 2003. Data on wild boar demography were obtained from 1132 shot wild boars sampled between 1999 and 2003 in different hunting estates of the study area. Briefly, we considered 40% of births to occur in December–January, and 60% in February–March, an average litter size of 3·85 piglets, 95% fertility among females heavier than 30 kg, and a slightly female-biased sex ratio of 0·55. Data on the females shot in this particular estate (n=23) were used to estimate the percentage that were of reproductive age (68%). This percentage had been estimated by Ahmad et al. [31] to be 61%. Harvest was known in detail for this hunting estate. Based on different aspects of wild boar development, behaviour, and diet, we assumed that new individuals begin to produce visible signs of activity by the age of 6 months [32–35].
A hunting index of population abundance was used to compare with the FBII in the large-scale study. In this case, we used data from driven hunts from 28 sites, representing the 2002–2003 hunting season. We estimated capture effort (Ct) by the direct index [35], where the captures by unit effort are defined as proportional to population size:
 |
where K=constant (dependent on the effectiveness of the hunters); N=captures (total captures/number of hunters).
Disease prevalences
Data on the prevalence (or seroprevalence) of four widely distributed disease agents (ADV, PCV2, MTBC and Metastrongylus spp.) with different epidemiological characteristics were employed to look for relationships between these prevalences, the FBII and the aggregation index.
We used the seroprevalence of PCV2 as an example for a directly transmitted viral agent (probably via aerosols [36]). In our study area, high PCV2 seroprevalence in wild boars was related to intensively managed hunting estates [9].
The seroprevalence of ADV has also been previously described for our study area [7]. In contrast to PCV2, ADV remains infectious within the host for life, and transmission can also occur venereally or via the consumption of carcasses or hunting remains [37].
Tuberculosis due to MTBC is widespread among wild boars in southern Spain [8], and the associated macroscopic lesions are well defined [38]. Hence, we used the prevalence of macroscopic TB-compatible lesions as an example of a bacterial disease that can be transmitted both directly (e.g. via aerosols) and indirectly (via contaminated food or water).
Finally, we used a helminth genus, Metastrongylus, as an example of an indirectly transmitted parasite. This nematode is common in the helminth fauna of Spanish wild boars [39], and is transmitted via consumption of earthworms, which are intermediate hosts [40].
We excluded from the correlations those localities with less than 10 animals tested for a given disease, and those localities where all samples were negative. In order to detect disease hotspots, we used the ‘Intercon’ tool of Idrisi 32 software version I32.21 (The Clark Labs, Clark University, Worcester, UK), to interpolate the prevalences of MTBC, PCV2 and ADV. This was done only in the core part of the study area, where sufficient sampling sites were available.
Statistical analysis
In the local study, we used a χ2 test to make sure that habitats were sampled in a stratified manner, and Spearman’s rank correlations to examine relationships between the FBII and the estimated absolute density (calculated from the direct counts and the population-dynamics data). The effect of habitat and season was analysed by means of a two-way ANOVA. When carrying out parametric tests, data were transformed according to ref. [41] to conform to normality.
Primarily, in the large-scale study, Spearman’s rank correlations were used to examine relationships between the FBII, the aggregation index and the hunting-index data. Second, ANOVAs were used for analysing the effect of the management type on the FBII and the aggregation index. We used a post-hoc Fisher’s PLSD test. This test is considered to be one of the least conservative post-hoc tests (for a detailed discussion of different post-hoc tests see ref. [42]).
Finally, we used Spearman’s rank correlations to study the relationship between the FBII, the aggregation index, and the prevalence of the four diseases mentioned earlier.
The significance level was set at 5% for all tests. We used SPSS 10.06 statistical software (SPSS Inc., Chicago, IL, USA) for the analyses.
RESULTS
Effects of season and habitat
In the 13-month survey, a χ2 test did not reject the null hypothesis of no difference between the sampled habitats and a stratified design (χ2=2·00, d.f.=1, P=0·162).
Season had an influence on the frequency of presence of droppings, and the interaction between season and habitat was also significant (season: F3-588=17·46, P=0·000; habitat: F1-588=3·22, P=0·073; interaction: F3-588=2·85, P=0·036). The independent estimate based on direct counts and population-dynamics data was correlated with the FBII (rs=0·69, P<0·01, n=13). The average aggregation index value in the 13-month survey was (±s.e.) 2·91±3·11 (range 0·00–9·77) and only marginal differences between seasons in the aggregation index were observed (Kruskal–Wallis test, χ2=6·66, d.f.=3, P=0·08).
Effects of estate management regime
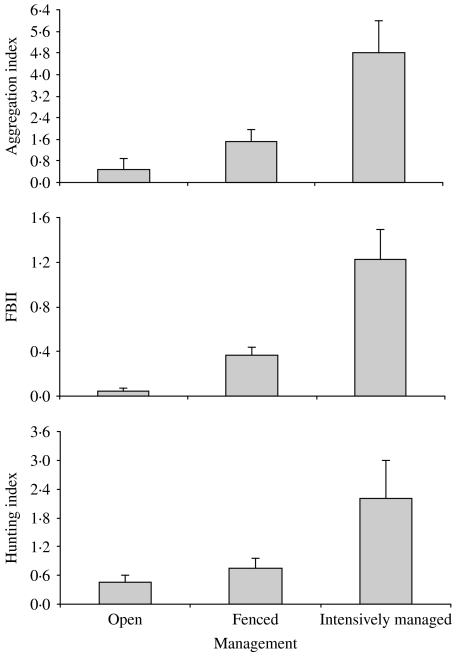
Management differences between study sites (open, fenced, intensively managed) in September were clearly reflected in differences in the FBII (F2-35=16·42, P<0·01). The aggregation index also yielded management-related differences, as well as the hunting-index data (F2-35=6·40, P<0·01 and F2-25=5·59, P<0·01 respectively, see Fig. 1). The results of the post-hoc Fisher’s PLSD test are shown in the Table. The index based on droppings showed differences between each different management type, while the aggregation index showed no differences between open and fenced estates.
Fig. 1.
Management effect on aggregation index, FBII, and hunting index.
Table.
Results of the post-hoc Fisher’s PLSD test
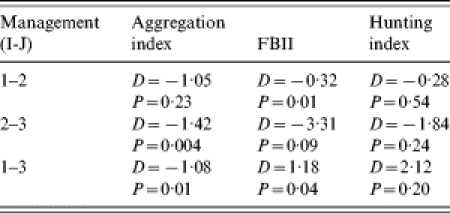
Management type 1 represents open estates, type 2 represents fenced estates, and type 3 represents intensively managed (farm-like) estates. D represents the differences between the mean values for each method in management types I and J. P is the level of significance.
The hunting index ranged between 0·05 and 3·83 boars shot/hunter. This hunting index was correlated with the FBII (rs=0·65, P<0·01, n=28). Spearman rank correlations showed that the aggregation index was correlated with the FBII (rs=0·62, P<0·01, n=38) and also with the hunting index (rs=0·67, P<0·01, n=28).
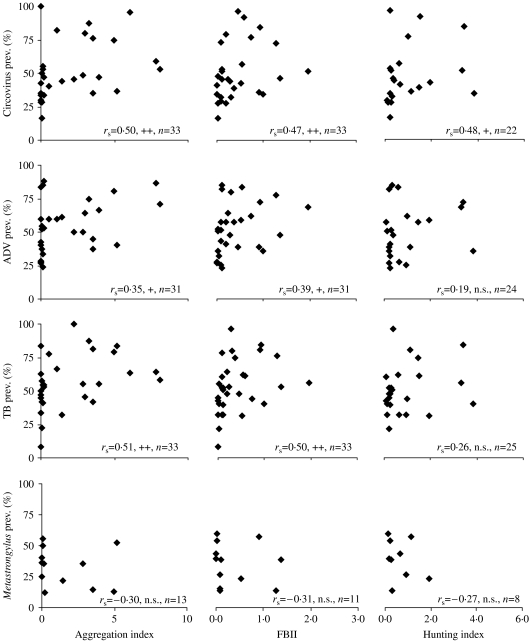
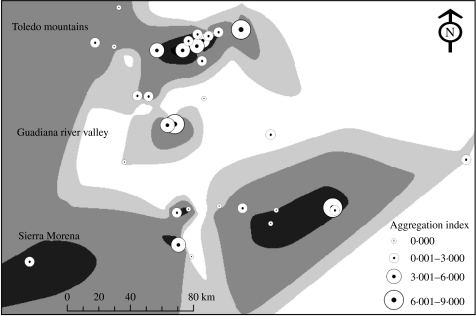
When analysing the correlation between hunting-index data, FBII abundance, aggregation index, and the four diseases (Fig. 2), it became evident that both the FBII and the aggregation index showed better correlations with the disease prevalences, than the hunting-index data. Moreover, the aggregation index showed more relationships with the disease prevalences than the abundance index (Fig. 2). Using the interpolation analysis, it became evident that the areas with higher prevalences of infectious diseases coincided with the highest spatial aggregations (Fig. 3).
Fig. 2.
Spearman rank correlations between the prevalences of the four diseases, aggregation index, FBII and hunting index. Levels of significance of the statistical analysis: n.s., not significant; +P<0·05; ++P<0·01.
Fig. 3.
Relationship between prevalence of infectious diseases and spatial aggregation in the European wild boar. The grey background represents the spatial distribution of the sum of prevalences of MTBC, PCV2 and ADV (darker means higher prevalence, 0–10, 11–50, 51–100, 101–150, >150). Circles represent the aggregation index obtained in each study site (n=32). The circle diameter is proportional to the spatial aggregation.
DISCUSSION
We provide a multidisciplinary approach to the study of disease transmission and management in wildlife. This research adds a valuable tool to assess wild boar abundance and aggregation since up to now high sampling has been required to estimate wild boar abundance, and usually the expense and effort required to estimate true population sizes makes this prohibitive. This method will help in risk management and in future research to study not only disease transmission variation with population size, but also the effects of host interactions and contact rates (e.g. the spatial or social structure of a population may influence the rate of disease spread and disease persistence). Such information will be crucial to the understanding of how the wild boar population structure impacts on disease transmission and the implications for management.
Data presented show that, at least in Mediterranean habitats with high wild boar densities, the FBII combined with the aggregation index have a close relationship to other wild boar abundance estimation methods and can be valuable in epidemiological surveys. Previous studies used the number of signs detected per unit effort to estimate wild boar abundances [43]. By using the frequency of detection of signs, we attempted to reduce the effect of sign aggregation on the abundance estimates [44].
The FBII [9], appeared to be sensitive to the abundance variations of the breeding season. The apparent ability of the FBII to detect changes in wild boar density at the temporal scale, makes this index suitable for management purposes such as the estimation of mortality rates due to hunting harvest or outbreaks of disease. Nonetheless, seasonal and habitat-related factors must be taken into account when using the FBII. For large-scale studies it is advisable to perform counts in a defined season, when weather conditions are relatively constant, and with a random-habitat stratified design. In our study area, September seems an adequate period for these counts, due to its low rainfall rate and to the lower habitat-related differences in frequency of droppings observed during this season.
The possibility of estimating an aggregation index from the same sampling effort further improves the usefulness of the index based on droppings. The aggregation index proposed here will help in understanding the epidemiology of infectious diseases in wild ungulates [45]. As expected, the aggregation index correlated with the abundance estimates, suggesting that highest aggregations do occur at high population densities (up to 90 ind/km2), for example in hunting estates that use game-feeders. In fact, independent estimates of wild boar aggregation, such as number of animals per water-hole, were correlated with the aggregation index based on droppings and the runs test (J. Vicente, unpublished observations). For that reason, we suggest that the aggregation index described in this paper is an indicator of actual spatial aggregation.
This is important in understanding the epidemiological risks of wild boar overabundance. Higher abundances not only mean a larger number of hosts available for any transmissible disease, they also mean a proportionally higher contact rate between hosts, and hence greater possibilities for disease transmission. In fact, the data show that the aggregation index does better explain the prevalence of certain diseases than the FBII. These diseases are both directly transmitted ones (PCV2, ADV), and directly and indirectly transmitted ones, such as tuberculosis. The lack of correlation with Metastrongylus was expected, since this parasite has an indirect life cycle where earthworms are intermediate hosts. Nonetheless, it must be interpreted with care due to the low number of sampling localities were the prevalences were obtained.
Relationships between hunting index and disease prevalence were analysed with low sampling size, and therefore the correlation coefficient was lower than with other indices used. The hunting index was difficult to obtain due to the lack of cooperation of some hunting estate owners who were unwilling to provide information on the number of wild boars killed [22]. In addition, there are localities with scarce or no hunting activities (e.g. protected areas). In contrast, the FBII (and aggregation index) can be obtained at any time of the year, even outside the hunting season. The method is cheap and easy to learn and permits a single observer to obtain an abundance estimate and calculate an aggregation index in less than 1 day of fieldwork.
Overabundant wild boar populations do already exist in areas of central and southern Spain, where wild boar hunting is an important socio-economic activity. But wild boar densities are also increasing in more natural areas of northern Spain due to the increasing quality of habitat [5, 46] and due to its precocity and high reproductive rate [47]. This causes serious concerns regarding disease control, since different local populations are well above the threshold that allows infectious diseases to be maintained without introductions from other wild or domestic sources. This may explain, for example, the high seroprevalence of ADV in central and southern Spanish wild boar populations [7], and the fact that TB has been circulating among wild ungulates in fenced estates for over 20 years without any contact with domestic livestock [8].
ACKNOWLEDGEMENTS
We thank Emilio Virgós for his advice in the initial steps of the fieldwork design, and Oscar Rodríguez, Manuel Reglero, Isabel G. Fernández de Mera, and Diego Villanúa for helping with the fieldwork. Alfredo Peña and many owners and managers of hunting estates provided access to the study sites. The wild boar study was supported by projects AGL2001-3947 and AGL2005-07401, Ministerio de Ciencia y Tecnología and FEDER. A wider study on wildlife TB is supported by INIA, MCYT RTA03-074, and by Grupo Santander. Census methods and overabundance are addressed in project PREG-05-19, Consejería de Medio Ambiente, JCCM. Jorge Cassinello and Francisco Ruiz-Fons received supported from the Ministerio de Educación y Ciencia, through a Ramón y Cajal contract and a FPU grant, respectively.
DECLARATION OF INTEREST
None.
REFERENCES
- 1.Sáez-Royuela C, Tellería JL. The increased population of wild boar (Sus scrofa) in Europa. Mammal Review. 1986;16:97–101. [Google Scholar]
- 2.Cargnelutti B, Spitz F, Valet G. Analysis of the dispersion of wild boar (Sus scrofa) in southern France. Ongules/Ungulates. 1992;91:423–425. [Google Scholar]
- 3.Gipson P, Hlavachick B, Berger T. Range expansion by wild hogs across the central United States. Wildlife Society Bulletin. 1998;26:279–286. [Google Scholar]
- 4.Rosell C, Herrero J., Palomo LJ, Gisbert J.Sus scrofaAtlas de los Mamíferos Terrestres de España Madrid: SECEM – SECEMU; 2002306–309. [Google Scholar]
- 5.Gortazar C et al. Historical examination of the status of large mammals in Aragon, Spain. Mammalia. 2000;64:411–422. [Google Scholar]
- 6.Rossi S et al. Incidence and persistence of classical swine fever in free-ranging wild boar (Sus scrofa) Epidemiology and Infection. 2005;133:559–568. doi: 10.1017/s0950268804003553. [DOI] [PMC free article] [PubMed] [Google Scholar]
- 7.Vicente J et al. Large-scale serosurvey of Aujezsky’s disease virus infection in European wild boar in Spain. Veterinary Record. 2005;156:408–412. doi: 10.1136/vr.156.13.408. [DOI] [PubMed] [Google Scholar]
- 8.Gortazar C et al. Molecular characterization of Mycobacterium tuberculosis complex isolates from wild ungulates in South-Central Spain. Veterinary Research. 2005;36:43–52. doi: 10.1051/vetres:2004051. [DOI] [PubMed] [Google Scholar]
- 9.Vicente J et al. Epidemiological study on porcine circovirus type 2 (PCV2) infection in the European wild boar (Sus scrofa) Veterinary Research. 2004;35:243–253. doi: 10.1051/vetres:2004008. [DOI] [PubMed] [Google Scholar]
- 10.Ginsberg HS, Zhioua E. Influence of deer abundance on the abundance of questing adult Ixodes scapularis (Acari: Ixodidae) Journal of Medical Entomology. 1999;36:376–381. doi: 10.1093/jmedent/36.3.376. [DOI] [PubMed] [Google Scholar]
- 11.Lancia RA. Estimating the Number of Animals in Wildlife Populations. Research and Management Techniques for Wildlife and Habitats. Bethesda: The Wildlife Society; 1994. pp. 215–253. [Google Scholar]
- 12.Caley P. Population dynamics of feral pigs (Sus scrofa) in a tropical riverine habitat complex. Wildlife Research. 1993;20:625–636. [Google Scholar]
- 13.Massei G et al. Factors influencing home range and activity of wild boar (Sus scrofa) in a Mediterranean coastal area. Journal of Zoology. 1997;242:411–423. [Google Scholar]
- 14.Sweitzer RA et al. Estimating sizes of wild pig populations in North and Central Coast of California. Journal of Wildlife Management. 2000;64:521–543. [Google Scholar]
- 15.Mayle BA, Putman RJ, Wyllie I. The use of trackway counts to establish an index of deer presence. Mammal Review. 2000;30:233–237. [Google Scholar]
- 16.Welander J. Spatial and temporal dynamics of wild boar (Sus scrofa) rooting in a mosaic landscape. Journal of Zoology (London) 2000;252:263–271. [Google Scholar]
- 17.Engeman RM et al. Monitoring changes in feral swine abundance and spatial distribution. Environmental Conservation. 2001;28:235–240. [Google Scholar]
- 18.Ickes KL. Hyper-abundance of native wild pigs (Sus scrofa) in a lowland dipterocarp rain forest of peninsular Malaysia. Biotropica. 2001;33:682–690. [Google Scholar]
- 19.Focardi S, Isotti R, Tinelli A. Line transect estimates of ungulate populations in a Mediterranean forest. Journal of Wildlife Management. 2002;66:48–58. [Google Scholar]
- 20.Tellería JL, Sáez-Royuela C. Demographic evolution of wild boar (Sus scrofa) in Spain [in French] Mammalia. 1985;49:195–202. [Google Scholar]
- 21.Boitani L et al. Spatial and activity patterns of wild boars in Tuscany. Journal of Mammalogy. 1994;75:600–612. [Google Scholar]
- 22.Fernández-Llario P et al. Habitat effects and shooting techniques on two wild boar (Sus scrofa) populations in Spain and Portugal. Zeitschrift für Jagdwissenschaft. 2003;49:120–129. [Google Scholar]
- 23.Sirén A, Hambäck P, Machoa J. Including spatial heterogeneity and animal dispersal when evaluating hunting: a model analysis and empirical assessment in an Amazonian community. Conservation Biology. 2004;18:1315–1329. [Google Scholar]
- 24.Lescourret F, Genard M. Search for signs of feeding and investigation of the summer habitat used by wild boar (Sus scrofa L.) in the Herault area [in French] Gibier Faune Sauvage. 1985;1:63–73. [Google Scholar]
- 025.Herrero J.Sus scrofaThesisMadrid, Spain: Complutense University; 2002 [Google Scholar]
- 26.Hone J, Martin W. A study of dung decay and plot size for surveying feral pigs using dung counts. Wildlife Research. 1998;25:255–260. [Google Scholar]
- 27.Abaigar T, del Barrio G, Vericad JR. Habitat preference of wild boar (Sus scrofa L., 1758) in a Mediterranean environment. Indirect evaluation by signs. Mammalia. 1994;58:201–210. [Google Scholar]
- 28.Vincent JP, Gaillard JM, Bideau E. Kilometric index as biological indicator for monitoring forest roe deer populations. Acta Theriologica. 1991;36:315–328. [Google Scholar]
- 29.Siegel S. Estadística no paramétrica. México: Trillas; 1970. [Google Scholar]
- 30.Focardi S et al. The use of distance sampling and mark-resight to estimate the local density of wildlife populations. Environmetrics. 2002;13:177–186. [Google Scholar]
- 31.Ahmad E et al. Reproduction in Eurasian wild boar in central Punjab, Pakistan. Acta Theriologica. 1995;40:163–173. [Google Scholar]
- 032.Abaigar T.Sus scrofaThesisPamplona, Spain: 1990 [Google Scholar]
- 33.Fernández-Llario P, Mateos-Quesada P. Body size and reproductive parameters in the wild boar Sus scrofa. Acta Theriologica. 1998;43:439–444. [Google Scholar]
- 34.Spitz F, Gleize JC, Duncan P. Characteristics of the weight growth in wild boar: the case of Camargue’s populations (south of France) [in French] Mammalia. 1990;54:405–414. [Google Scholar]
- 35.Eberhardt LL. 1960.
- 36.Segalés J, Domingo M. Postweaning multisystemic wasting syndrome (PMWS) in pigs. A review. Veterinary Quarterly. 2002;24:109–124. doi: 10.1080/01652176.2002.9695132. [DOI] [PubMed] [Google Scholar]
- 37.Gortazar C et al. Natural Aujeszky’s disease in a Spanish wild boar population. Annals of the New York Academy of Sciences. 2002;969:210–212. doi: 10.1111/j.1749-6632.2002.tb04380.x. [DOI] [PubMed] [Google Scholar]
- 38.Gortazar C, Vicente J, Gavier-Widen D. Pathology of bovine tuberculosis in the European wild boar. Veterinary Record. 2003;152:779–780. doi: 10.1136/vr.152.25.779. [DOI] [PubMed] [Google Scholar]
- 39.Fernandez-de-Mera I et al. Wild boar helminths: risks in animal translocations. Veterinary Parasitology. 2003;115:335–341. doi: 10.1016/s0304-4017(03)00211-5. [DOI] [PubMed] [Google Scholar]
- 40.Cordero del Campillo M, Rojo FA. Parasitología Veterinaria. Spain: McGraw-Hill, Interamericana; 1999. [Google Scholar]
- 41.Zar JH. Biostatistical Analysis. 2nd. New Jersey: Prentice-Hall Inc.; 1984. [Google Scholar]
- 42.Winer BJ, Brown DR, Michels KM. Statistical Principles in Experimental Design. 3rd. New York: McGraw-Hill; 1991. [Google Scholar]
- 43.Welander J. Spatial and temporal dynamics of wild boar (Sus scrofa) rooting in a mosaic landscape. Journal of Zoology. 2000;252:263–271. [Google Scholar]
- 44.Rowland MM, White CG, Karlen EM. Use of pellet-group plots to measure trends in deer and elk populations. Wildlife Society Bulletin. 1984;12:147–155. [Google Scholar]
- 45.Artois M et al. Classical swine fever (hog cholera) in wild boar in Europe. Revue Scientifique et Technique de l’Office International des Epizooties. 2002;21:287–303. doi: 10.20506/rst.21.2.1332. [DOI] [PubMed] [Google Scholar]
- 46.Virgós E. Factors affecting wild boar (Sus scrofa) occurrence in highly fragmented Mediterranean landscapes. Canadian Journal of Zoology. 2002;80:430–435. [Google Scholar]
- 47.Spitz F, Bourliere F., Lamotte M, Bourliere F.Population dynamics of mammalsProbléme d’Ecologie: La dèmographie des populations des vertebrés Paris: Masson; 1975 [Google Scholar]


