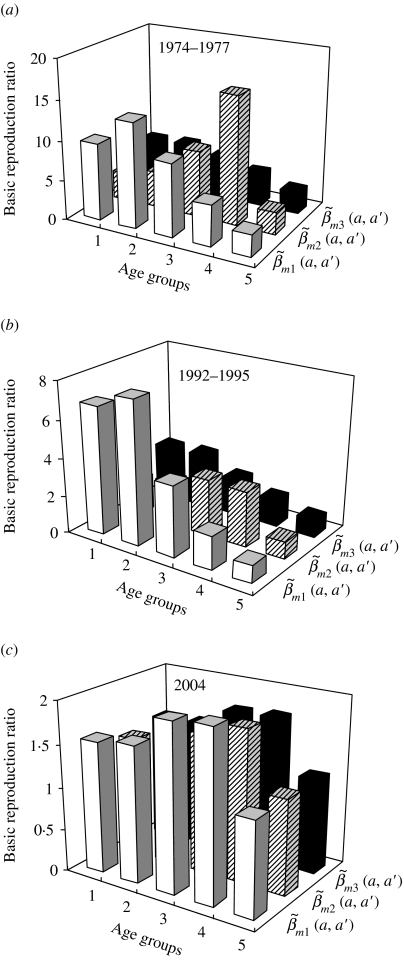
Fig. 3.
Estimates of age group-specific basic reproduction ratio varied with three contact pattern matrices structures of  ,
,  and
and  (see Appendix 1). The five age groups are 0–1, 2–3, 4–6, 7–14, and 15–35 years. (a) 1974–1977, (b) 1992–1995, and (c) 2004 nationwide vaccination programmes.

