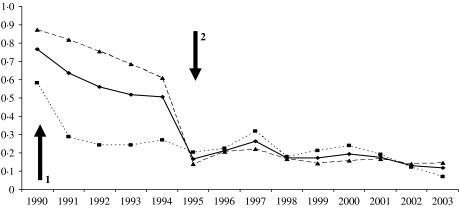
Fig. 3.
Proportion of H. influenzae cases identified by laboratories that were not picked up by enhanced surveillance for all regions (–◆–), Wales/five regions (····■····) and the other regions (- - -▲- - -). Arrow 1=initiation of Wales/five regions enhanced surveillance; arrow 2=extension of enhanced surveillance to all England and Wales.

