
Table.
Prevalence of zoonotic pathogens in Norway rats from Baltimore, Maryland, USA 2005–2006
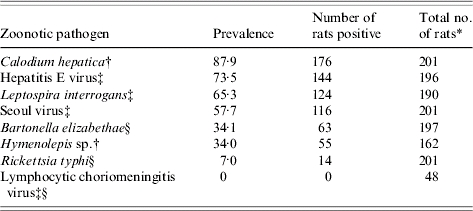
*
Unequal sample sizes due to sample availability.
†
Pathogen prevalence determined by microscope evaluation.
‡
Seroprevalence determined by ELISA.
§
Seroprevalence determined by IFA.