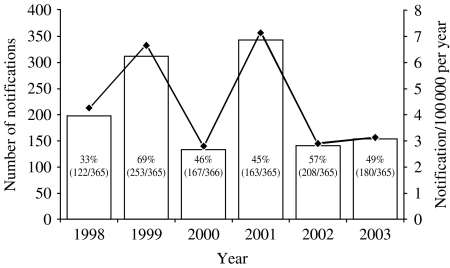
Fig. 1.
Number and rate of measles notifications received and the proportion of days in each year in an epidemic period, Victoria, 1998–2003 (n=1281). (Victorian population based on estimated annual mid-year data; Australian Bureau of Statistics [16].) □, Number; –◆–, rate.

