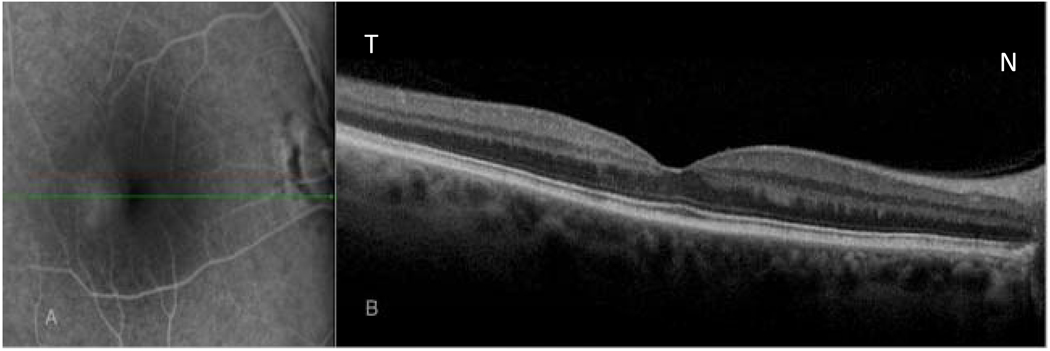
Figure 3.
Simultaneous fluorescein angiogram and spectral domain optical coherence tomography (Spectral - OCT) images from a patient with diabetic macula edema. A, Late phase fluorescein angiogram shows ill defined diffuse leakage temporal to the fovea. B, Corresponding OCT image through the area of leakage. B-scan OCT shows normal retinal morphology
Central foveal thickness was 275µm.
N-nasal, T- temporal.

