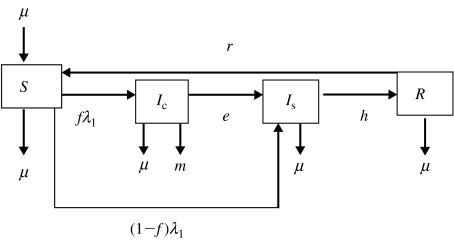
Fig. 1.
Flow diagram representing model 1. Four transition states are included: susceptible (S), clinically infected (Ic), subclinically infected (Is) and recovered (R). Animals move from S to Ic at rate fλ1 and from S to Is at rate (1−f)λ1, where f is the proportion of infected animals that develop clinical disease. Clinically infected animals progress to Is at rate e. Animals in Is acquire immunity at rate h. The immunity of recovered animals wanes at rate r. Exit for all compartments and replacement for compartment S takes place at rate μ. Animals in Ic also exit the compartment at rate m.

