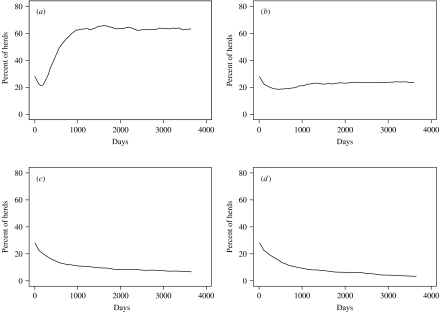
Fig. 5.
Output (predicted percent of herds as level 2) from a single iteration demonstrating the effect of the input variable describing the per-herd, per-day probability of environmental exposure (EEP): (a) EEP=10−3, (b) EEP=10−4, (c) EEP=10−5, and (d) EEP=10−6. The results for EEP=10−6 are representative of results for EEP <10−0·55 (additional plots not shown).

