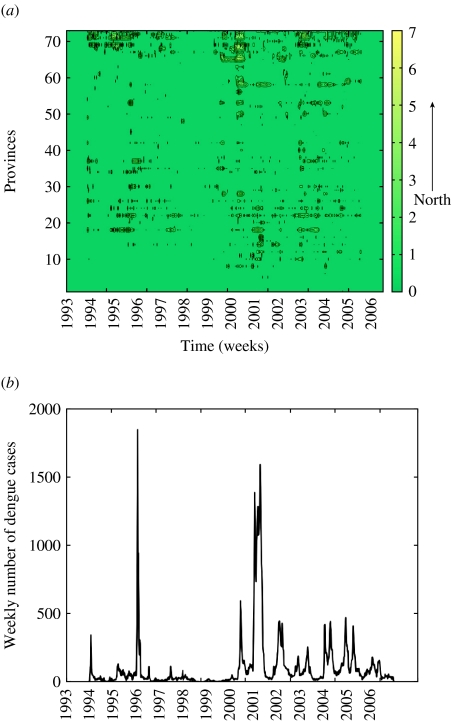
Fig. 2.
(a) Weekly dengue incidence per 100 000 people in each of the 73 provinces [8] reporting dengue in Peru during the period 1994–2006. For visualization purposes, we took the log-transformation of the dengue incidence. Data were sorted by latitude coordinate from south to north. (b) The aggregated dengue epidemic curve of the new number of dengue cases by symptom onset during the period 1994–2006.

