
Table 1.
Distribution of cases of acute HBV infection and controls with corresponding odds ratios (OR) and 95% confidence intervals (CI)
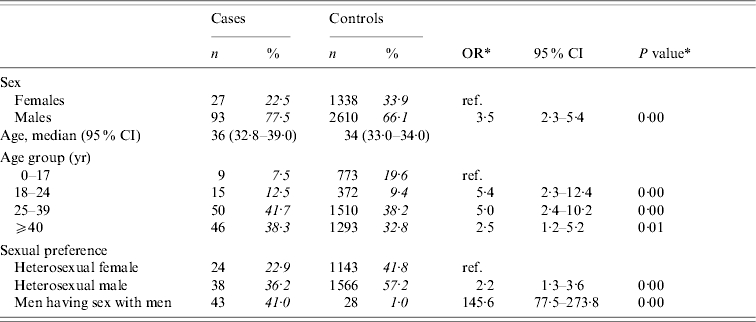
The analyses included 120 cases and 3948 controls. Percentages were calculated after excluding individuals with missing information.
*
Odds ratios and P values were calculated by weighted analyses, taking into account oversampling of men and those aged 20–39 years among controls.