
Table 2.
Summary of the best-fitting estimates of the basic reproduction number, the percentage of infected individuals who experience clinical symptoms and the proportion of clinical cases which were reported to the GP practice, which were associated with the best-fitting matrices of Who Acquires Infection From Whom
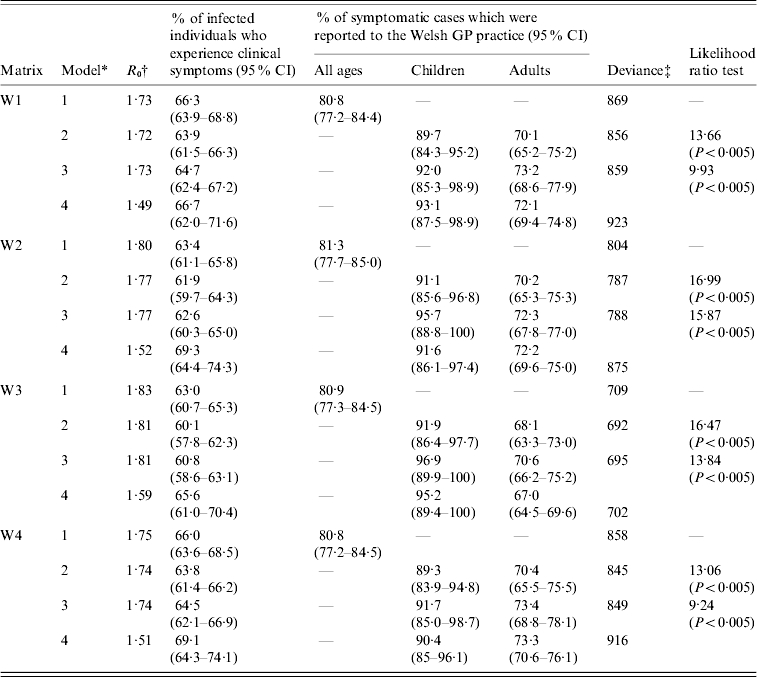
Model 1: proportion of cases which are reported to the GP practice is assumed to be identical for all age groups; Model 2: proportion of cases which are reported to the GP practice is assumed to differ between those aged ⩽16 and >16 years; Model 3: proportion of cases which are reported to the GP practice is assumed to differ between those aged ⩽11 and >11 years; Model 4: the assumptions are identical to those in Model 2, except that the latent and infectious periods each equal 1·5 days.
The basic reproduction number associated with each matrix was calculated using standard techniques (i.e. as the dominant eigenvalue of the Next Generation Matrix [14]).
The number of degrees of freedom for model 1 is 130 (matrices W2 and W3) and 129 (matrices W1 and W4); for models 2–4, the number is 129 (matrices W2 and W3) and 128 (matrices W1 and W4).