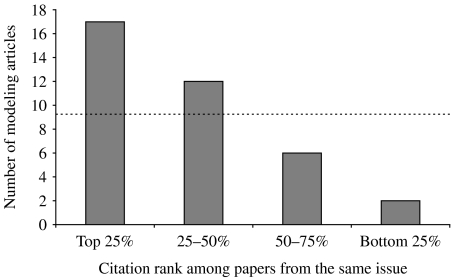
Fig. 3.
Citation impact of modelling articles: number of modeling articles from our list that were among the top 25% most cited articles published in the same issue of the same journal, and numbers of modelling articles from our list whose citation ranks were within the 25–50%, 50%–75% or bottom 25% range. The line represents the expected values for a uniform distribution of citation ranks.

