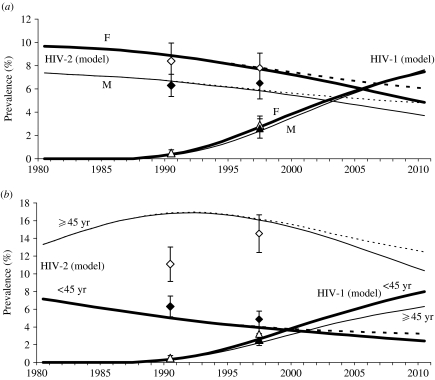
Fig. 2.
Observed (with 95% CI) and simulated HIV-1 and HIV-2 prevalence in Scenario 2 (behaviour change) stratified by gender (a) and age (b). All values standardized using the age and sex composition in 1997. Observed HIV-1 prevalence shown as triangles. Observed HIV-2 prevalence shown as diamonds. White markers show data on (a) females and (b) on adults aged ⩾45 years. Black markers show data on (a) males and (b) on adults aged 15–44 years. The dashed lines show the HIV-2 prevalence trends in the absence of HIV-1.

