
Table 3.
Test-specific prevalence estimates and 95% confidence intervals (95% CI) for each British ovine scrapie surveillance target population stratified by PrP genotype, estimated from the survey data of January 2002 to March 2003 (inclusive) except for the column in italics where prediction of the genotype frequency distribution from the standard fallen-stock population was required in order to estimate the denominator, and positive test results from the fallen-stock surveys between April 2003 and December 2004 were used as the numerator
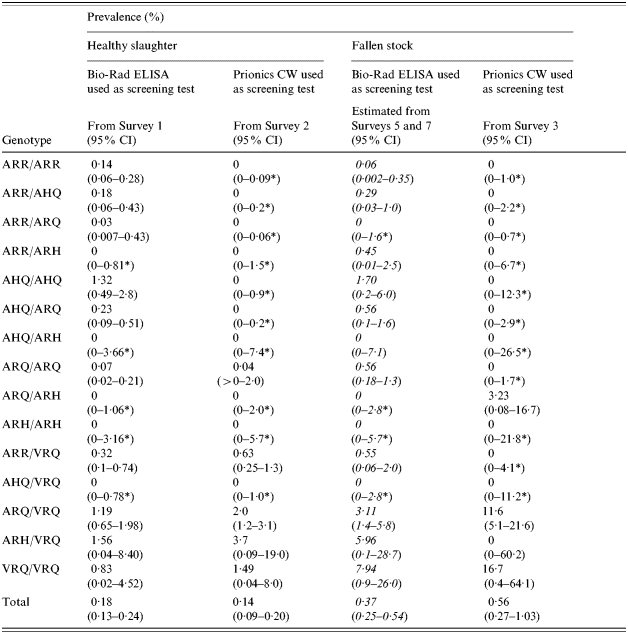
*
One-sided 97·5% CI.