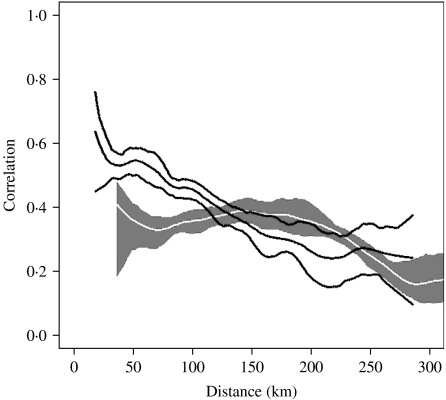
Fig. 3.
Spatial synchrony of the long-term mode of periodicity of measles incidence in Maryland as a function of distance. Spatial synchrony provides a measure of the correlation of series as a function of spatial distance separating them. The black curve surrounded by black 95% confidence intervals indicates the correlation of counties that are not separated by the Chesapeake Bay. The white curve surrounded by grey 95% confidence intervals indicates the correlation of counties that are separated by the Chesapeake Bay (meaning the line between the centroids of the counties intersects the Chesapeake Bay). The figure indicates that at a distance of ∼120 km the correlation of pairs separated by the bay is significantly less than the correlation of pairs not separated by the bay.

