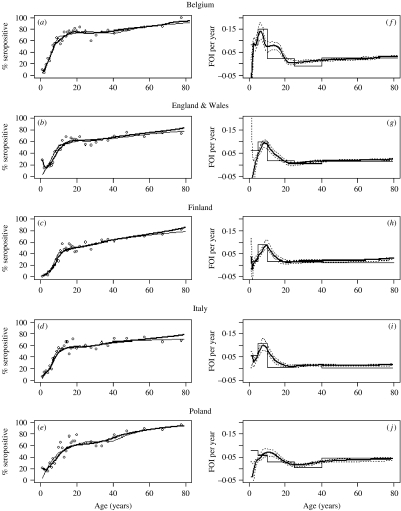
Fig. 2.
Panels (a–e) show different estimates of parvovirus B19 seroprevalence profiles in Belgium, England & Wales, Finland, Italy and Poland, respectively. The open symbols (○) indicate point estimates for each age group, the thick line indicates the local quadratic model and the thin line indicates the piece-wise constant model. Panels (f–j) show the force-of-infection (FOI) estimates corresponding to the seroprevalence profiles in panels (a–e), respectively. The thick line indicates the local quadratic model; the dotted line represents 95% confidence intervals of the local quadratic model, and the thin line the piecewise constant model.

