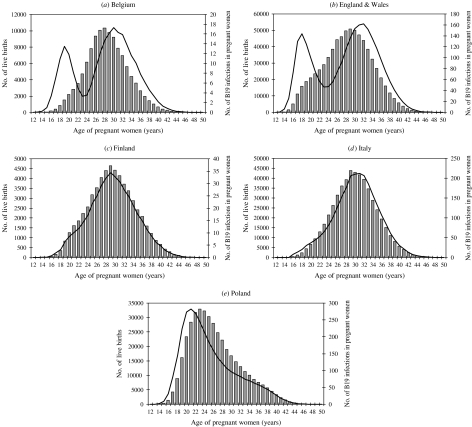
Fig. 4.
Distribution of live births by age of mother in 1997 (shown by histograms, y-axis on the left) according to Eurostat, and distribution by age of annual estimated number of B19 infections occurring during pregnancy based on the local quadratic model of seroprevalence and force of infection (––––, y-axis on the right).

