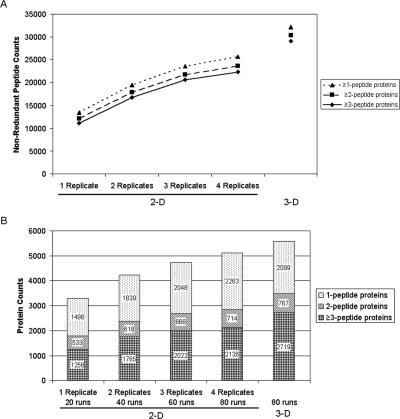
Figure 4.
Comparison of peptide and protein coverage for the 2-D and 3-D methods. (A) Nonredundant peptide counts from a single 2-D analysis, combined data from increasing numbers of replicate analyses, and the 3-D method. (B) Corresponding nonredundant protein counts for the same data sets as shown in panel A. The total number of LC-MS/MS runs that each data set contains is shown at the bottom of the figure.

