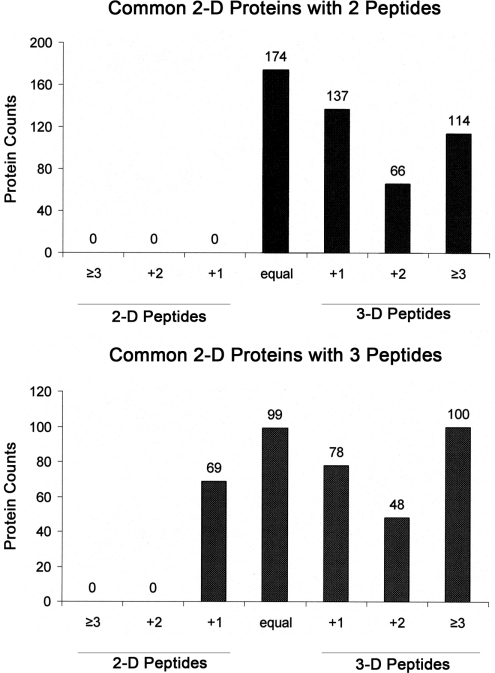
Figure 6.
Comparison of the number of peptides identified in the 2-D/repetitive and 3-D methods. (A) Among proteins common to both data sets, 491 proteins were identified by two peptides in the 2-D/repetitive data set. The 3-D method found an equal number of peptides for 174 proteins and more peptides for 317 proteins. (B) Among 394 proteins identified with three peptides by the 2-D method, the 3-D method found one less peptide for 69 proteins (i.e., +1 for 2-D), an equal number of peptides for 99 proteins, and more peptides for 226 proteins.

