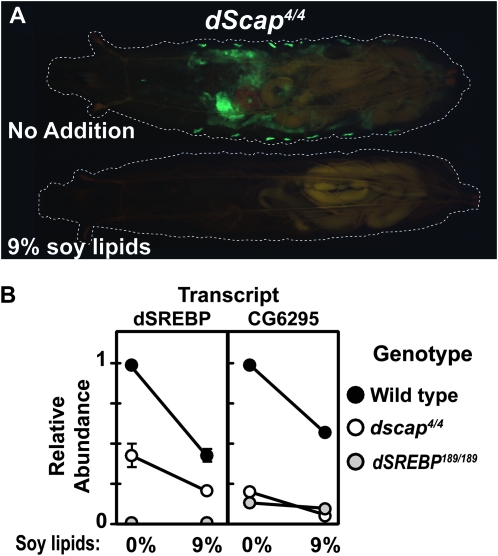
Figure 6.—
(A) Comparison of GFP fluorescence in dscap4 homozygotes grown on semidefined medium (upper) or the same medium supplemented with 9% soy lipids (lower). Larvae are dscap4/dscap4; P{GAL4-dSREBPg}, P{UAS-GFP}/P{GAL4-dSREBPg}, P{UAS-GFP}. Dashed lines denote extent of larval bodies. Exposure = 2.5 sec. (B) Quantitative RT–PCR analysis of dSREBP and CG6295 transcripts of wild-type (black circles), dscap4 (white circles), and dsrebp189 (gray circles) larvae grown on semidefined medium (0%) or the same medium supplemented with 9% soy lipids (9%). Transcript abundance is relative to wild-type larvae on 0%. Error bars represent the SEM.

