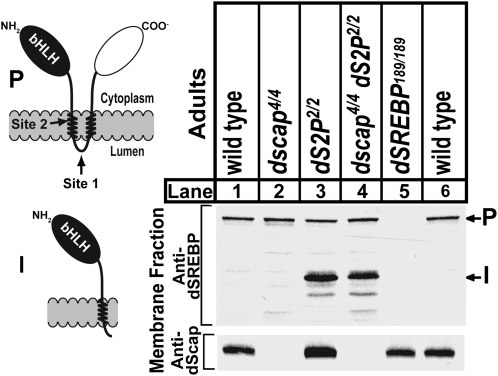
Figure 9.—
Immunoblot analysis of membrane fractions from adults of the indicated genotypes. The schematic shows SREBP topology. bHLH designates the transcription factor domain. The shaded bar represents the lipid bilayer. Arrows indicate the site 1 protease and site 2 protease cleavage sites. NH2 and COO− designate the amino and carboxy termini. The intermediate form cleavage product (I) is illustrated below. Membrane fractions were prepared as described (materials and methods) and probed with IgG-3B2 against dSREBP. Membranes were then stripped and reprobed with IgG-7A8, against dScap. Sixty micrograms of total protein was loaded per lane. Membranes were exposed for 30 sec. P, precursor; I, intermediate form.

