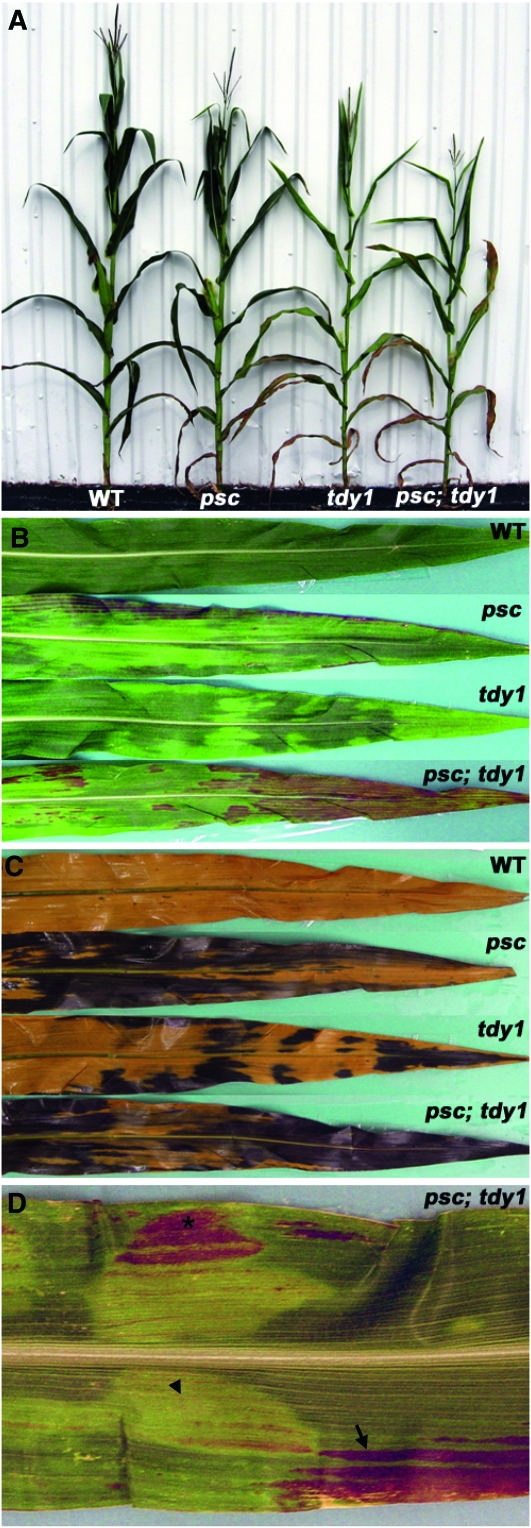
Figure 7.—
psc and tdy1 exhibit an additive genetic interaction. (A) Photograph of mature wild-type (WT), psc, tdy1, and psc; tdy1 double mutant plants. (B) Leaves from wild type, psc, tdy1, and psc; tdy1 double mutants. (C) Same leaves as shown in B, cleared and IKI stained. (D) Close-up of overlapping tdy1 and psc chlorotic tissues from a psc; tdy1 double mutant. Arrow indicates longitudinally streaked psc chlorotic tissue accumulating anthocyanins. Arrowhead indicates tdy1 chlorotic region. Asterisk indicates severely chlorotic tissue expressing both the psc and tdy1 chlorotic phenotypes and accumulating anthocyanins.

