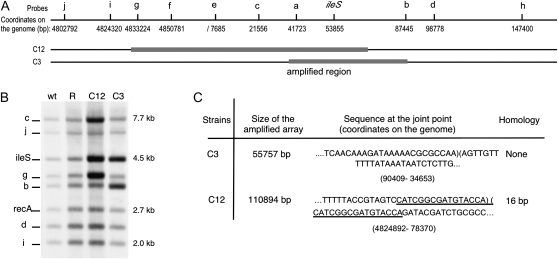
Figure 3.—
(A) Localization of the markers a–j used as probes for Southern blot. A gray rectangle indicates the amplified regions determined from Southern blot done with several set of probes. (B) Marker frequency hybridization with a set of the probes (ileS, j, g, b, d, i, and recA used as standard) and targets chosen so that each probe lights up one band of distinct size (see materials and methods for details). (C) Size of the amplified arrays and sequence at the joint points in the lineages C3 and C12.

