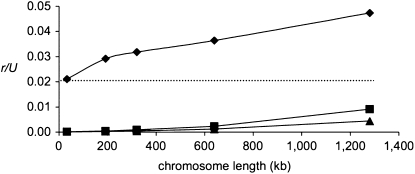
Figure 2.—
The effect of increasing the number of sites subject to BGS on the rate of fixation of “major” mutations (the values are the averages of four simulation runs). Diamonds: U = 3.78 and s = 0.63, which correspond to the scaled values of U = 0.009 and s = 0.0015 as estimated for the D. miranda neo-Y. Selection at the BGS sites is drawn from a log-normal distribution with Ns(harmonic mean) = 10. The dashed line indicates the simulated value of r/U when there is no BGS. Squares, U = 2.50, s = 0.63; triangles, U = 1.89, s = 0.63.

