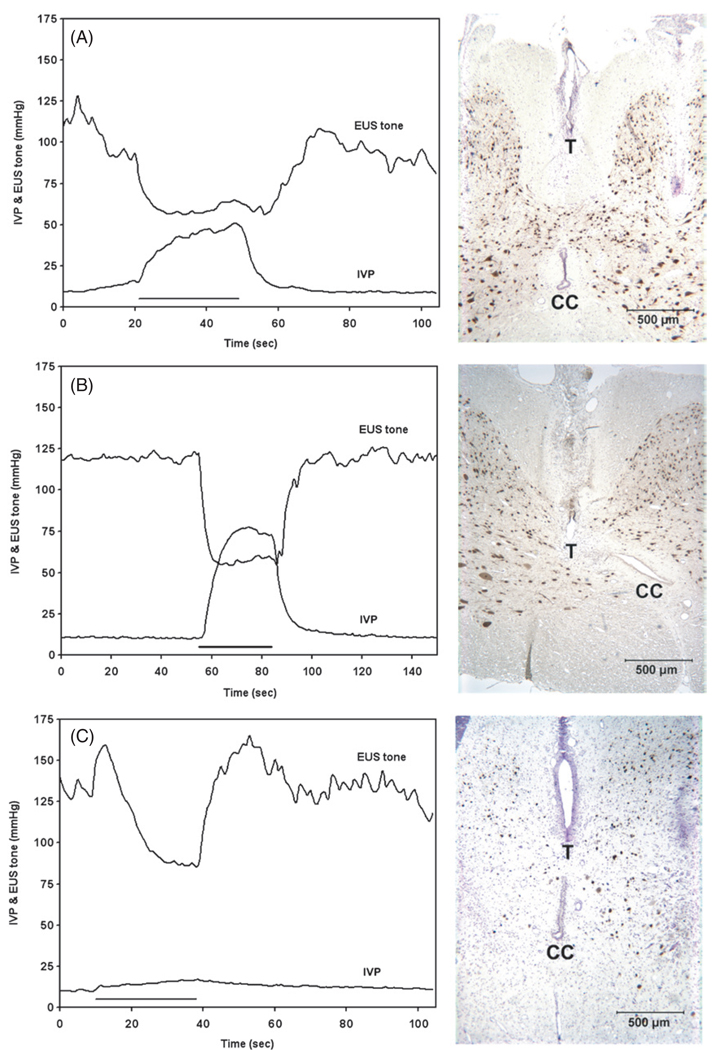
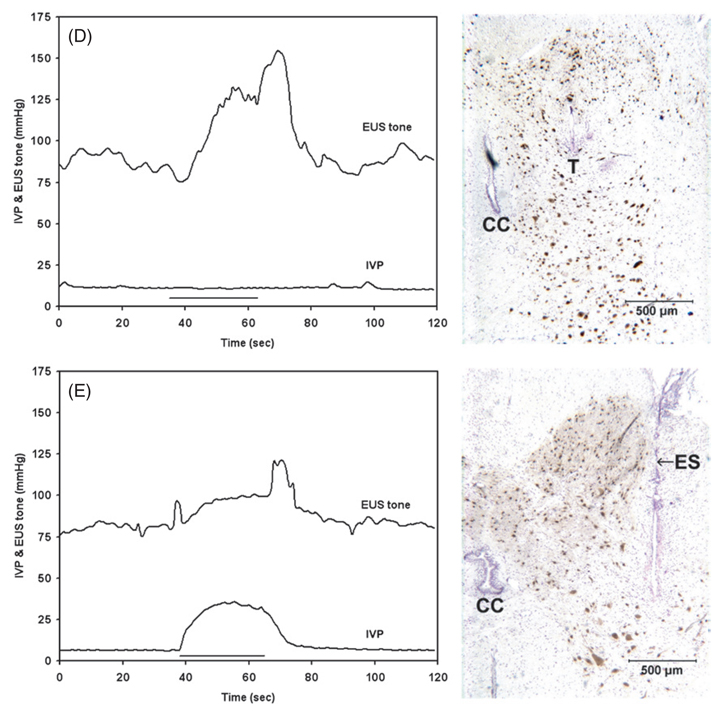
Figure 1.
Changes in intravesical pressure (IVP) and EUS tone during stimulation with individual intraspinal microelectrodes. The left panels show IVP and EUS tone as a function of time, where the duration of the applied stimulation train is indicated by a solid horizontal line. The right panels are the photomicrographs of the sites of the microelectrodes in the sacral spinal cord. The tips of discrete electrodes (T) or electrode sites of the silicon probes (ES), as well as the central canal (CC), are indicated. The spinal cord tissue was immunostained with NeuN and counterstained with Cresyl Violet. Panels (A)–(E) represent five examples of evoked bladder and EUS activities. The stimulus current amplitude in all cases was 100 µA. IVP and EUS tone responses were examined simultaneously in (A) and (C)–(E), and separately in (B). The microelectrode sites in the right panels were located in the middle S1 (A), (C), caudal S1 (B), (E) and rostral S2 levels (D). See results for further details.


