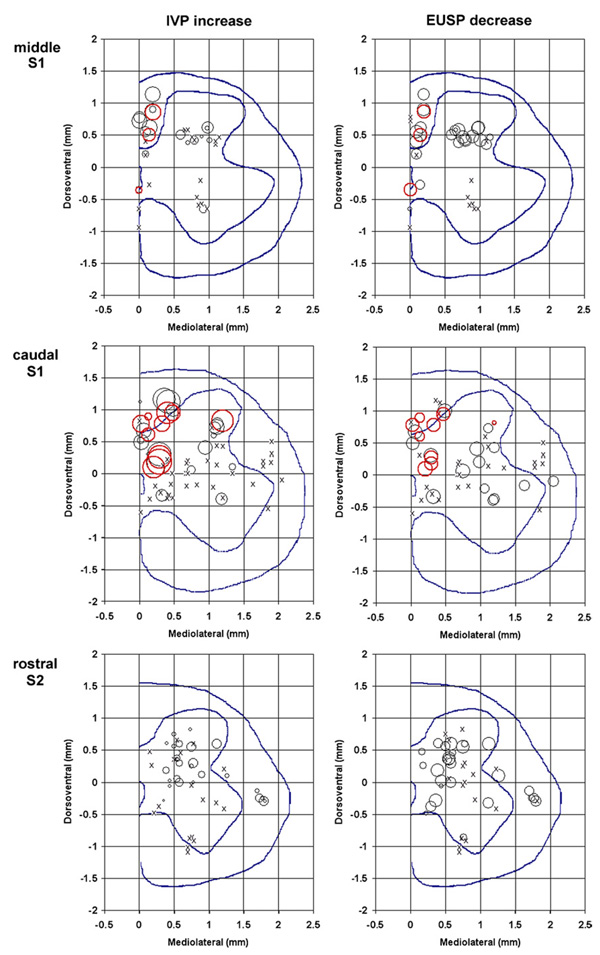
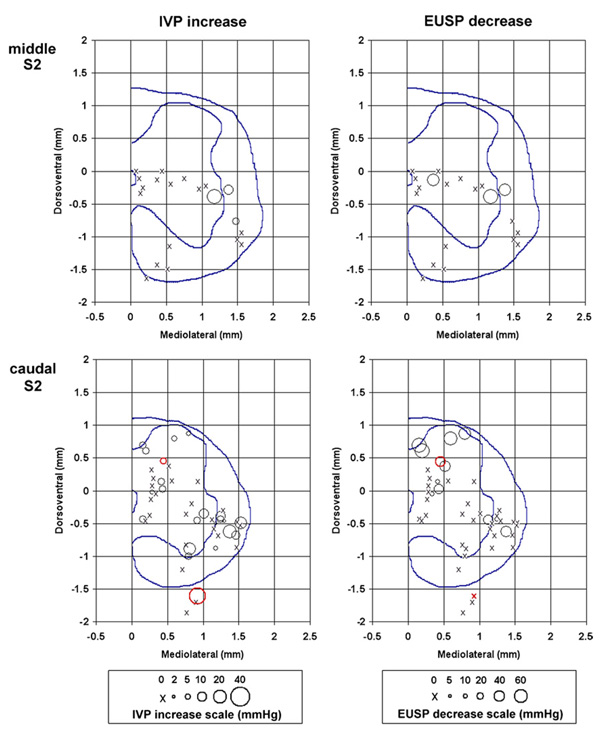
Figure 3.
Tip/electrode site locations in the sacral spinal cord of the microelectrodes that produced micturition-related effects. The left panels show the increases in the intravesical pressure (IVP) and the right panels show decreases in the EUS pressure (EUSP) for different microelectrode locations. Red circles (online) indicate electrodes that were effective in producing at least drop-by-drop voiding. The circle size indicates the amount of pressure change from the baseline level. The scales relating the circle sizes and pressure changes are presented below the panels. The mediolateral and dorsomedial coordinates are given in reference to the dorsal edge of the central canal. The dotted lines in each panel represent the boundary of the gray matter and the location of the central canal.


